
How to Create Vendor Purchase Orders for Apparel & Footwear


You don’t optimize multi-warehouse inventory to make things easier.
You do it because not optimizing it is what’s killing your margins.
When you're managing stock across 3, 5, or even 15 warehouses, decisions that once seemed small—like where to store 300 units of your top seller—can snowball into massive fulfillment delays, stockouts in one region, and overstock in another. All while your carrying costs quietly eat away at your profits.
Multi-warehouse inventory optimization isn’t just a “nice-to-have” for growing brands, 3PLs, or distributors—it’s the only way to run lean, fulfill faster, and scale without chaos.
This guide breaks down how optimization actually works:
If you’re still treating every warehouse the same, this blog will show you how to change that—and why your future inventory performance depends on it.
Right SKUs. Optimum stock
with Smart triggers.

Multi-warehouse inventory optimization is the process of strategically distributing your inventory across multiple storage locations—using data, demand patterns, and cost variables—to maximize availability while minimizing excess and inefficiencies.
But let’s be clear: it’s not just splitting your stock evenly across warehouses.
It’s about answering questions like:
At its core, this approach aims to balance stock availability, fulfillment speed, and operational costs across your entire distribution network. The more warehouses you have, the more complex this equation gets—and the more important optimization becomes.
Done right, it means:
And behind it all is a dynamic model—often powered by AI or advanced planning systems—that continuously analyzes demand signals, lead times, and capacity constraints to recommend the best distribution of stock.
Optimizing inventory across multiple warehouses isn’t a single action—it’s an ongoing system built on data, forecasting, prioritization, and automation.
Here’s a step-by-step breakdown of how the process works:
Before you optimize, you need to unify the mess.
Pull in data from:
Why it matters: Optimization is only as good as the data feeding it. If your systems don’t talk to each other, you’re flying blind.
One-size-fits-all forecasting breaks here.
Instead, use location-specific forecasting:
Example: If black sneakers sell 4x more in the Northeast during Q4, your forecast must reflect that—warehouse stock allocation should too.
Not all products are equal. And not all warehouses should treat them the same.
Segment inventory by:
This helps determine:
Now comes the core of optimization: determining how much of each SKU should go where.
This includes:
Tools involved:
Inventory optimization software, prescriptive analytics, constraint-based models, or even AI-powered allocation engines.
Once stock is distributed, it won’t stay optimal forever. You need smart replenishment.
This includes:
This prevents overstock in one place while another warehouse is stocked out.
Optimization is not a set-it-and-forget-it system.
You need to:
The best systems self-learn—they get smarter as more demand and inventory data flows through.
Brand: Noir Atelier – A fast-growing D2C and wholesale fashion brand
Inventory Setup: 4 regional warehouses – East Coast (US), West Coast (US), EU (Netherlands), and India (production + fulfillment)
Problem: Frequent stockouts in high-demand zones, high split-shipment costs, and slow cross-border deliveries
Noir Atelier expanded rapidly across the US and Europe, but their inventory planning couldn’t keep up.
Here’s what they were facing:
The result? Slower fulfillment, lower conversion rates during restocks, and shrinking profit margins due to excess logistics spend
To fix it, they implemented a multi-warehouse inventory optimization system using a combination of WMS, demand forecasting, and inventory planning tools.
After three months of rollout:
Right SKUs. Optimum stock
with Smart triggers.
You can’t optimize what you don’t measure.
Tracking the right metrics across all your warehouses helps you understand if your inventory is in the right place, at the right time, and moving at the right pace.
Here are the most critical KPIs to monitor:
Formula:
Inventory Turnover = Cost of Goods Sold / Average Inventory
Why it matters:
Shows how efficiently inventory is selling at each warehouse. A low turnover may indicate overstock; too high means potential stockouts.
Use to rebalance inventory or flag slow-moving SKUs by location.
Formula:
(Fulfilled Order Lines / Total Order Lines) x 100
Why it matters:
Measures your ability to fulfill customer orders from existing stock—critical for customer satisfaction and SLA compliance.
Track per warehouse to identify stock placement gaps.
Formula:
(Orders Shipped from Multiple Warehouses / Total Orders) x 100
Why it matters:
Split shipments increase shipping costs and complexity. A high rate usually points to poor stock allocation or imbalanced inventory levels.
Lower this to improve fulfillment efficiency and margin.
Formula:
(Out-of-Stock Days / Total Days) x 100 or
(Unfulfilled Demand / Total Demand) x 100
Why it matters:
Reveals missed sales and service-level breaches. High rates = lost revenue and unhappy customers.
Use to improve safety stock and location-based forecasts.
Formula:
Carrying Cost = Inventory Value x Carrying Cost % (typically 20–30%)
Why it matters:
Shows how much it costs to hold inventory—varies by warehouse depending on rent, labor, utilities, etc.
Useful for ROI analysis on decentralization vs centralization
Formula:
(Average Inventory / COGS) x 365
Why it matters:
Helps you understand how long stock will last at current sales velocity. Long DOH = risk of obsolescence or markdowns.
Track this at warehouse + SKU level for optimization.
Why it matters:
Frequent transfers often indicate poor initial allocation or inaccurate regional forecasts.
Too many = inefficiency. Too few = potential missed opportunities to avoid stockouts.
Formula:
Order Cycle Time = Time from Order Placement to Shipment
Why it matters:
Measures fulfillment speed, often tied to customer experience and operational efficiency.
If a specific warehouse has longer cycle time, dig into WMS or labor issues.
Formula:
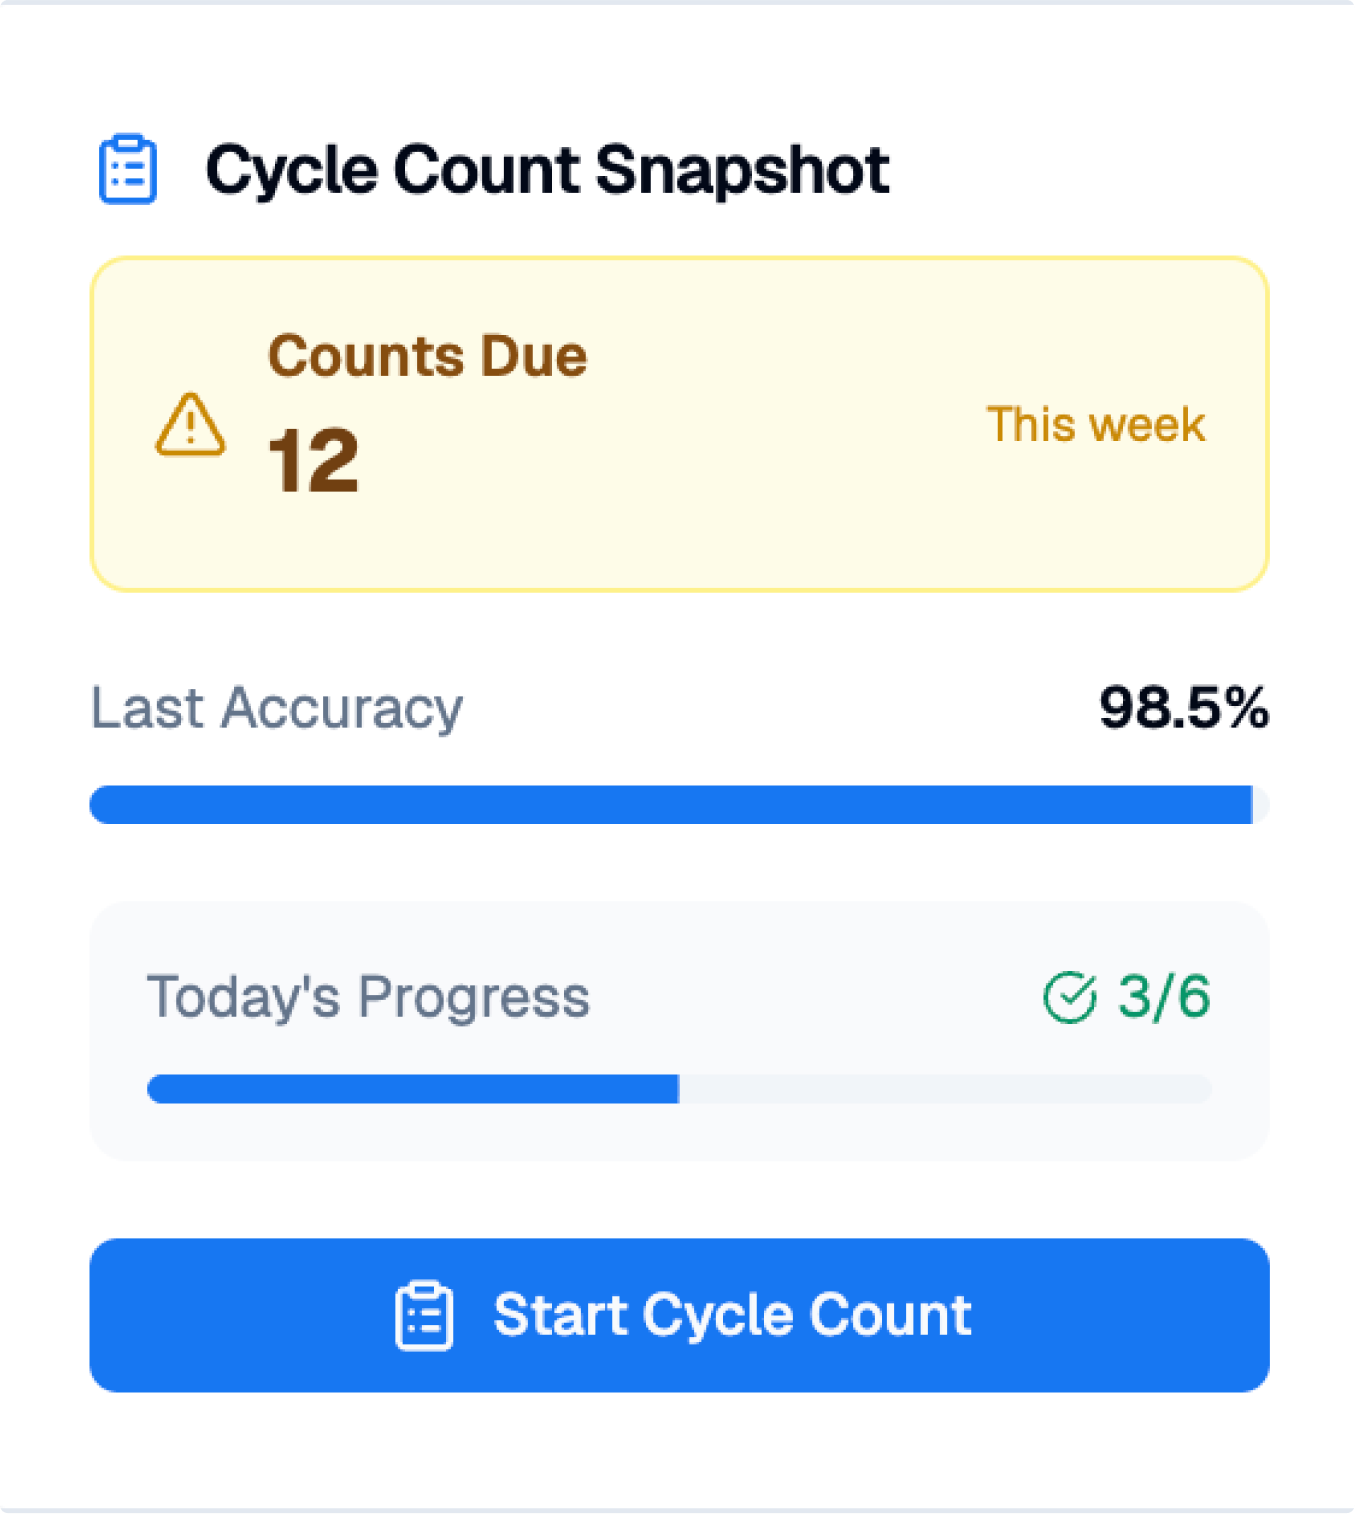
(Counted Inventory / System Inventory) x 100
Why it matters:
Shows the reliability of your inventory data, which directly impacts optimization accuracy.
Inaccurate data → incorrect replenishment, misallocations, and stockouts.
Formula:
Mean Absolute Percentage Error (MAPE)
= |Forecast - Actual| / Actual x 100
Why it matters:
Forecasting is the engine behind optimization. Poor location-level forecast accuracy drives every other metric down.
Aim for <15% MAPE on core SKUs for high-performance operations.
Managing inventory across multiple warehouses is hard. EasyReplenish makes it easier—and smarter.
Our platform is purpose-built to help growing brands, distributors, and fulfillment teams take control of complex inventory networks with precision.
With EasyReplenish, you can:
Whether you’re running 3 warehouses or 30, EasyReplenish gives you the visibility, intelligence, and automation you need to optimize stock distribution—and protect your bottom line.
Right SKUs. Optimum stock
with Smart triggers.

No credit/debit card required • Cancel anytime


.png)

.png)