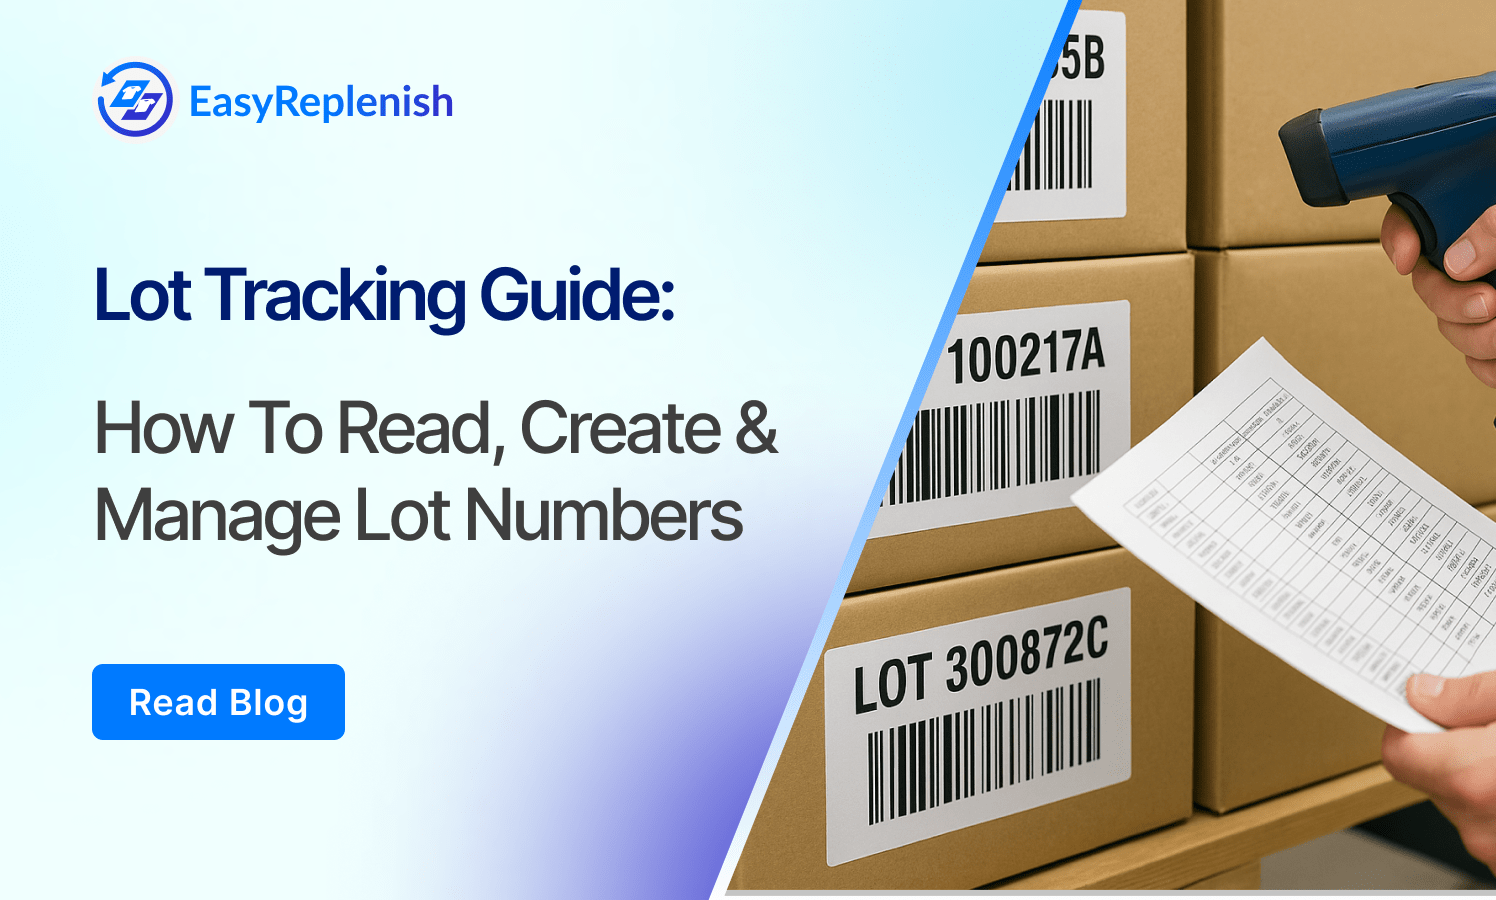
Lot Tracking Guide: How to Read, Create & Manage Lot Numbers


Buffer stock, also known as reserve or backup inventory, plays a critical role in protecting your supply chain against uncertainty. Whether it’s a supplier delay, unexpected surge in demand, or internal fulfillment issue, buffer stock ensures that operations don’t grind to a halt due to stockouts. It’s especially important in industries where demand is volatile, lead times are unpredictable, or service level expectations are high.
Calculating the right buffer stock isn’t a one-size-fits-all process. It requires understanding demand variability, supply lead times, and the cost implications of holding extra inventory. In this blog, we’ll explain how to calculate buffer stock, break down the formula, and show how different industries approach it based on their operational needs.
Buffer stock is the quantity of extra inventory kept on hand to prevent stockouts caused by demand spikes, supplier delays, or internal inefficiencies. Unlike regular inventory used to fulfill forecasted demand, buffer stock serves as a contingency layer—it’s not meant to be consumed under normal conditions.
It’s often confused with safety stock, and while the two are closely related, buffer stock is typically positioned as an additional safeguard beyond calculated safety levels. Some businesses treat buffer stock as a fixed quantity layered on top of their reorder point, while others calculate it dynamically based on real-time variability in demand and lead time.
By maintaining the right amount of buffer stock, companies can maintain high service levels, avoid missed sales, and reduce operational disruptions—even in unpredictable conditions.
Style levelSell-through with OOS days —
adjusted,Gross margin, ageing etc.
Buffer stock is typically calculated using a variation of the safety stock formula that incorporates both demand variability and lead time uncertainty. A common, effective formula is:
Buffer Stock = (Maximum Daily Usage × Maximum Lead Time) − (Average Daily Usage × Average Lead Time)
This formula helps estimate the extra inventory needed to cover worst-case scenarios compared to what’s normally required.
Let’s say a brand sells 100 units on average daily, but on peak days it sells up to 150 units. The average lead time is 5 days, but due to supply chain delays, it can sometimes stretch to 8 days.
Buffer Stock = (150 × 8) − (100 × 5)
Buffer Stock = 1,200 − 500 = 700 units
So, 700 units would be the buffer stock required to maintain operations if lead time delays and demand spikes occur simultaneously.
This formula can be adapted based on the business's inventory sophistication. Some brands use historical volatility and service-level targets to calculate buffer stock probabilistically, especially when using advanced planning tools.
Different industries face different levels of demand variability, lead time risks, and service-level expectations. As a result, buffer stock planning must be tailored to the operational realities of each sector. Here’s how leading industries approach buffer stock calculation:
In fashion, buffer stock is often influenced by seasonality, style complexity, and size fragmentation. Since SKU-level demand can be unpredictable—especially for new launches—brands may maintain buffer stock for fast-moving sizes (like M and L) or for core products that sell consistently across seasons. Lead times from overseas manufacturers can vary, making additional buffer necessary around collection drops or high-velocity items.
Approach: Brands often use historical size-level velocity and lead time buffers based on supplier reliability, adding buffer only for top-selling sizes or colors within each style.
Formula:
Buffer Stock = (Max Daily Sales × Max Lead Time) − (Avg Daily Sales × Avg Lead Time)
Example:
A brand sees peak daily sales of 80 units for Size M of a core T-shirt, with max lead time of 15 days and average sales of 50 units with a 10-day average lead time.
Buffer = (80 × 15) − (50 × 10) = 1,200 − 500 = 700 units
Use Case: Maintain buffer only for fast-moving sizes during seasonal peaks or during promotional windows.
FMCG brands operate in high-volume, high-velocity environments where stockouts directly impact revenue. Promotions, regional spikes, and distributor variability create frequent demand shifts. For essential SKUs like personal care or packaged foods, brands maintain buffer stock close to point-of-sale locations to minimize service disruption.
Approach: Buffer stock is calculated using historical sales peaks and delivery variability across channels. AI tools often help maintain optimal stock at warehouses and retail partners.
Formula:
Buffer Stock = (Standard Deviation of Daily Demand × √Lead Time Days)
This is a common statistical approach in FMCG to reflect demand uncertainty over the lead time window.
Use Case: Applied across distributor warehouses and retail-facing fulfillment centers for high-priority SKUs like toothpaste, snacks, or beverages.
In pharma, service levels and regulatory compliance dictate extremely high availability for certain SKUs. Stockouts of critical medicines can have life-threatening consequences. Variability in raw material availability, especially for imported APIs, can stretch lead times.
Approach: Buffer stock is set based on target service levels (often 95–99%), lead time variability, and criticality of the product. Many companies maintain central safety stock hubs for at-risk molecules or life-saving drugs.
Formula:
Buffer Stock = Z × σ × √LT
Where:
Example:
To maintain a 98% service level for a critical drug with demand variability (σ = 20) and 12-day lead time:
Buffer = 2.05 × 20 × √12 ≈ 141 units
Use Case: Used to build centralized or regional safety stock reserves for critical APIs or finished goods.
Manufacturers hold buffer stock for raw materials, sub-assemblies, or critical spare parts where supplier lead times are long or inconsistent. Downtime due to material shortage can result in significant operational losses.
Approach: Buffer stock is tied to machine uptime needs, supplier reliability, and variability in production schedules. In just-in-time operations, minimal buffer is held—requiring extremely accurate planning and reliable suppliers.
Formula:
Buffer Stock = (Daily Usage × Lead Time Variability in Days)
Example:
If a plant uses 200 units daily and lead time can vary by ±3 days:
Buffer = 200 × 3 = 600 units
Use Case: Critical for imported components, tooling parts, or items with low supplier reliability.
Style levelSell-through with OOS days —
adjusted,Gross margin, ageing etc.
D2C brands often face cross-channel demand variability, last-minute spikes from influencer marketing, and unpredictable return cycles. Holding buffer stock near fulfillment centers ensures fast delivery without losing revenue to stockouts.
Approach: Buffer stock is dynamically adjusted based on real-time sales trends, shipping lead times, and return-adjusted net demand. Tools like EasyReplenish factor in marketing calendars and warehouse-level trends to optimize this buffer.
Each of these industries requires a nuanced buffer stock strategy—not just based on formulas, but also on context, risk tolerance, and operational agility.
Formula:
Buffer Stock = (Forecast Error % × Forecasted Demand During Lead Time)
Example:
Forecast error is 20%, and expected demand during a 7-day lead time is 2,000 units:
Buffer = 0.2 × 2,000 = 400 units
Use Case: Buffer stock is applied dynamically per SKU per warehouse, adapting to channel-level volatility.
Even with the right formulas, buffer stock planning can fail if key assumptions are outdated, oversimplified, or misaligned with actual demand patterns. Below are the most common mistakes businesses make when calculating or managing buffer stock.
Many businesses rely on fixed lead times, assuming supplier performance is consistent. In reality, lead times can fluctuate due to port delays, vendor capacity issues, or regulatory checks. Using a single lead time figure without tracking variability leads to either excess stock or unpreparedness during delays.
Relying solely on average demand overlooks the peaks, troughs, and seasonality that actually drive stockouts. Buffer stock should be tied to standard deviation or forecast error—not just historical averages—especially in fashion, D2C, or FMCG sectors where demand can spike rapidly.
Some businesses target extremely high service levels (98–100%) across all SKUs without assessing the cost trade-offs. This leads to bloated buffer stock, capital lock-in, and warehouse inefficiency. Instead, service levels should be tiered—based on SKU criticality, contribution margin, or customer impact.
A blanket buffer policy across all SKUs results in wasted inventory. High-volume or high-margin SKUs may need aggressive buffer stock, but fringe, slow-moving items often require none. SKU segmentation is essential to apply differentiated buffer logic based on sales velocity, criticality, and risk profile.
Demand patterns, supplier performance, and business conditions change rapidly. Brands that don’t recalibrate their buffer stock logic quarterly or after major demand shifts risk either frequent stockouts or overstock issues. Automation tools like EasyReplenish help dynamically adjust buffer thresholds based on real-time trends.
EasyReplenish is designed to take the guesswork out of buffer stock planning. Instead of relying on static formulas or outdated assumptions, it uses real-time data, SKU segmentation, and demand variability to calculate optimal buffer levels that reflect actual business conditions.
The platform analyzes each SKU’s demand patterns, forecast error, and lead time fluctuations to dynamically recommend buffer stock at the variant, location, and channel level. It accounts for promotional uplift, seasonal shifts, and supply risk—ensuring buffer is applied where it’s needed most, not just where it’s easiest.
For brands managing large catalogs, EasyReplenish supports tiered service level targeting—so critical SKUs can be assigned higher protection levels, while low-impact items are kept lean. The system continuously recalibrates buffer levels as demand signals change, reducing both excess inventory and stockout risk.
Style levelSell-through with OOS days —
adjusted,Gross margin, ageing etc.

No credit/debit card required • Cancel anytime


.png)
.png)
.png)

