How to Reduce Inventory Carrying Costs: Top 6 Proven Strategies
.png)
Inventory carrying cost is one of the most underestimated expenses in e-commerce and retail operations. It quietly erodes margins — tying up capital in products that sit on shelves, depreciate over time, and demand continuous storage, insurance, and maintenance.
On average, carrying costs account for 20–30% of total inventory value, meaning every $100,000 worth of stock could be costing a business up to $30,000 annually just to hold. For fast-moving industries like fashion, electronics, and consumer goods, this directly limits cash flow and scalability.
Consider this example: an e-commerce brand reduces its average carrying cost from 28% to 20% by optimizing reorder points and eliminating dead stock. That 8% improvement frees up thousands in working capital — funds that can now be reinvested in marketing, new SKUs, or customer acquisition.
Reducing carrying costs isn’t about minimizing stock; it’s about maximizing efficiency, liquidity, and profitability. In this guide, we’ll break down the key drivers of high inventory carrying costs and the most effective strategies to reduce them without risking stockouts.
Understanding Inventory Carrying Costs
Inventory carrying costs represent the total expenses associated with storing and maintaining unsold goods. These include not only the obvious costs like warehousing but also hidden financial drains that affect overall profitability.
Key Components of Carrying Costs:
- Capital Cost: The cost of money tied up in inventory that could otherwise be used for marketing, expansion, or new product development.
- Warehousing Cost: Rent, utilities, labor, and material-handling expenses.
- Depreciation & Obsolescence: Loss in value as products age, expire, or go out of fashion.
- Shrinkage: Inventory lost due to theft, damage, or administrative errors.
- Insurance & Taxes: Ongoing protection and compliance costs tied to stored goods.
Formula for Inventory Carrying Cost Percentage:
Inventory Carrying Cost (%) = (Total Carrying Cost ÷ Average Inventory Value) × 100
This formula helps quantify how much of your working capital is being consumed by storage and maintenance, rather than generating revenue.
Why Most Businesses Underestimate It:
Many e-commerce and retail brands focus only on visible costs like rent or storage fees, ignoring the hidden impact of tied-up capital, obsolescence, and data inaccuracy. As a result, their true carrying costs are often 30–50% higher than what’s reflected in accounting records.
Proven Strategies to Reduce Inventory Carrying Costs
Improve Forecast Accuracy — practical, measurable steps
Why it matters (brief): small gains in forecast accuracy compound — improving forecast error by 5–10% typically reduces excess stock and stockouts simultaneously, freeing working capital and lowering carrying cost.
Actionable approach
- Measure current accuracy (baseline): use MAPE to track forecast error per SKU or SKU group.
- Formula (copy-paste):
MAPE (%) = (1/n) × Σ(|Actual_i - Forecast_i| / Actual_i) × 100 - Target guidance: aim for MAPE ≤ 10–15% on fast movers, ≤ 20–25% on mid/slow movers. If you’re worse than this, fix data first.
- Formula (copy-paste):
- Fix data hygiene (non-negotiable):
- Clean SKU master: unify SKUs, remove duplicates, standardize attributes (size/color), assign categories.
- Normalize channel sales: convert marketplace refunds, returns, and cancellations into net demand.
- Backfill missing historicals and mark outliers (promotions, one-off bulk orders) as special events rather than “normal” demand.
- Use layered forecasting (hierarchical + causal):
- Layer 1: Category / brand level for low-volume SKUs (aggregated smoothing).
- Layer 2: SKU-level for top revenue/SKU velocity items.
- Add causal inputs: promotion schedule, planned marketing spend, paid ads CPM/CTR signals, social-traffic spikes. Treat these as uplift multipliers, not raw sales.
- Embed promotion and lifecycle logic: tag every marketing & influencer activity in the forecasting pipeline; assign uplift % ranges (measured historically) to automatically scale forecasts during campaign windows.
- Fast experiment loop: run a 6–8 week pilot on your top 200 SKUs:
- Split into control vs. treatment (treatment uses layered forecast + promotions).
- Track MAPE, stockouts, and excess units. If treatment reduces stockouts by X% and improves MAPE, roll out.
Example: If SKU sells 300 units/month historically but ad campaign expected to double traffic for 2 weeks, model baseline = 300, campaign uplift = +30% for month, adjusted forecast = 390. Use that in replenishment calculation rather than raw historical.
Implement a Smarter Replenishment Strategy — stop reacting; systematize
Why it matters: smarter replenishment reduces holding cost (fewer emergency small orders) and prevents lost sales from late responses.
Actionable framework
- Choose the right replenishment model by SKU class:
- Fast movers (A): Continuous review or very short periodic (daily/weekly).
- Medium (B): Bi-weekly periodic review with dynamic reorder points.
- Slow/long-tail (C): Monthly or push-based replenishment (make-to-order or small-batch restock).
- Use dynamic reorder points (not static):
- Reorder Point = (Average Daily Demand × Lead Time Days) + Safety Stock.
- Update Average Daily Demand and Lead Time monthly or after any supplier change.
- Leverage batch optimization (combine POs):
- Consolidate orders across SKUs or warehouses to hit supplier MOQ or reduce freight cost. Use a cost model to trade off holding vs ordering costs (see EOQ below).
- Economic Order Quantity (EOQ) — practical check:
- Formula (copy-paste):
EOQ = sqrt((2 × Annual Demand × Order Cost) ÷ Holding Cost per Unit) - Use EOQ as a sanity check — if replenishment qty ≫ EOQ for many SKUs, you may be over-ordering; if ≪ EOQ, you may be over-frequent ordering and paying excess order costs.
- Formula (copy-paste):
- Exception handling & automation:
- Automated alerts for supplier delays, sudden sales spikes, or inventory anomalies.
- Auto-create POs for A SKUs when Reorder Point breached; require manual review for B/C SKUs.
Pilot & validation
- Run a 90-day pilot on top 100 SKUs using dynamic reorder points + EOQ checks. Measure: reduction in emergency POs, average order size vs inventory turnover, carrying cost % improvement.
Example: If a SKU has 10 units/day demand and 14-day lead time with 50 units safety stock → Reorder Point = (10×14)+50 = 190 units. When on-hand <=190, PO is triggered automatically.
Optimize Safety Stock Levels — right-size the buffer, scientifically
Why it matters: safety stock is your insurance; too little → lost sales, too much → capital tied up. Optimize it dynamically.
Core method (practical)
- Use a statistical safety stock formula:
- Formula (copy-paste):
Safety Stock = Z × σ_demand × √Lead Time
where:
Z = z-score corresponding to desired service level (e.g., 1.28 for 90% service, 1.65 for 95%),
σ_demand = standard deviation of demand per period,
Lead Time = lead time in same periods (days/weeks).
- Formula (copy-paste):
- Calculate σ_demand correctly: measure demand variability over the same horizon used in forecasts (e.g., weekly demand SD for weekly review). Use rolling windows (e.g., last 26 weeks) to capture recent volatility.
- Adjust for supply-side variability: if supplier lead times vary, incorporate lead time variability into the formula (or use lead time distribution to compute expected LT SD). Example combined approach:
- If supplier lead time varies, use √(AverageLeadTime + VarianceLeadTime) in the formula or run Monte Carlo simulations for high-risk items.
- Service level segmentation: don’t use a single service level for all SKUs.
- A SKUs: 95–99% service level (high Z).
- B SKUs: 90–95%.
- C SKUs: 80–90% or use deferred replenishment.
Choose service levels based on margin impact and stockout cost per SKU.
- Implement dynamic safety stock: recalc safety stock monthly (or more frequently if demand/lead time shifts). Tie changes to automation so replenishment qty uses updated safety stock immediately.
Example calculation (copy-paste ready)
- Average daily demand = 20 units, σ_demand (daily) = 6 units, Lead Time = 14 days, target 95% service → Z = 1.65
Safety Stock = 1.65 × 6 × sqrt(14) ≈ 1.65 × 6 × 3.742 = 37.0 units
So keep ~37 units as buffer.
Validation & governance
- Monitor Service Level vs Inventory Cost: track fill rate and carrying cost % after safety stock adjustments. If fill rate improves but carrying cost spikes unacceptably, lower service level for lower-margin SKUs.
- A/B Safety Stock test: reduce safety stock by X% for a controlled set of C SKUs while increasing monitoring; if stockouts remain acceptable, apply wider reductions.
Streamline Warehouse and SKU Management — eliminate hidden storage inefficiencies
Why it matters:
A bloated SKU catalog and inefficient warehouse layout quietly inflate carrying costs through excess storage, labor, and depreciation. SKU rationalization and warehouse optimization can reduce inventory footprint by 10–25% without impacting sales.
Actionable framework
Step 1: Classify inventory scientifically (ABC/XYZ analysis).
- A items: Top 20% SKUs driving ~80% sales — prioritize accuracy and availability.
- B items: Mid-performing SKUs — maintain balanced inventory levels.
- C items: Long-tail or low-ROI SKUs — move to make-to-order, clearance, or vendor-managed models.
Use a blended ABC (value-based) + XYZ (demand variability) matrix to guide stocking frequency and review cadence.
Step 2: Rationalize SKUs based on profitability and turnover.
Remove redundant variations, low-margin items, or low-sales SKUs clogging storage. Example: If 60% of SKUs contribute <5% of revenue, eliminate or phase out through markdowns.
Step 3: Optimize warehouse layout and visibility.
Use real-time tracking (RFID, barcode scanners) and slotting algorithms to minimize travel time and optimize picking paths.
Example: A fashion brand reclassified SKUs using ABC-XYZ, cutting total storage space by 18% and carrying costs by 12%.
Negotiate Better Supplier Terms — share risk and reduce ownership cost
Why it matters:
Supplier relationships directly impact inventory cost. Poorly negotiated terms—like long lead times or rigid MOQs—force brands to overstock, locking up working capital. Smarter vendor agreements can shift that burden back to suppliers.
Actionable approach
Step 1: Shorten lead times and improve flexibility.
Negotiate shorter replenishment cycles or split shipments. Example: Instead of one large monthly order, move to two smaller biweekly shipments to reduce average on-hand inventory.
Step 2: Adopt consignment or vendor-managed inventory (VMI) models.
Under these models, suppliers retain ownership until goods are sold—directly reducing carrying costs. Works best for non-perishable, high-value SKUs.
Step 3: Align forecasts with suppliers.
Share real-time demand forecasts to let suppliers adjust production proactively. Use Collaborative Planning, Forecasting, and Replenishment (CPFR) frameworks to synchronize planning.
Example:
An electronics retailer moved 25% of slow-moving SKUs to consignment terms, reducing capital tied in inventory by $400k annually.
Adopt Cloud-Based Inventory Management Systems — automate visibility and control
Why it matters:
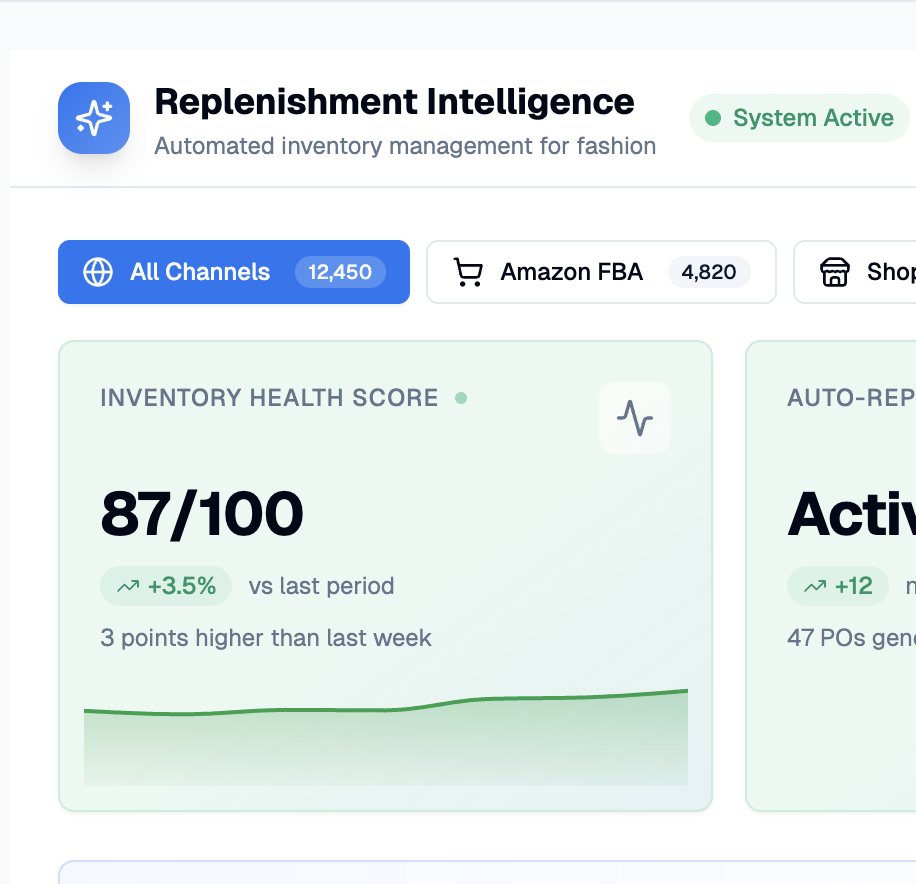
Manual inventory tracking limits visibility, delays decisions, and inflates holding costs. Cloud-based systems integrate data across warehouses, channels, and suppliers, enabling data-driven decisions that lower excess stock and improve accuracy.
Actionable approach
Step 1: Implement a centralized cloud platform.
Choose tools that consolidate sales, purchase, and fulfillment data into a single dashboard. Example platforms: EasyReplenish, NetSuite, Cin7.
Key benefits: real-time visibility, multi-location synchronization, and automatic reorder alerts.
Step 2: Automate key triggers and reports.
- Auto-trigger replenishment when stock falls below reorder point.
- Receive alerts for slow-moving SKUs or aging inventory.
- Generate dynamic ABC reports monthly to track SKU performance trends.
Step 3: Use analytics for early interventions.
Platforms like EasyReplenish identify dead stock early, simulate what-if scenarios, and recommend markdowns or transfers to clear excess before it becomes obsolete.
Example:
A D2C apparel brand using EasyReplenish automated 70% of its reorder tasks, achieving a 22% reduction in holding cost and a 30% improvement in inventory visibility.
Conclusion — Turning Inventory Efficiency into a Competitive Edge
Reducing inventory carrying costs isn’t about cutting stock blindly — it’s about creating a lean, intelligent system that adapts in real time. When forecasting accuracy, replenishment, and warehouse efficiency work in sync, businesses unlock cash flow, reduce waste, and strengthen service levels simultaneously.
Cloud-based solutions like EasyReplenish make this transformation measurable and repeatable — by automating visibility, recalibrating stock levels dynamically, and turning complex data into actionable decisions. The result: lower carrying costs, higher agility, and an inventory strategy built for scalability, not guesswork.
FAQs on Reducing Inventory Carrying Costs
1. How do I know which products are driving my carrying costs up?
Start by calculating inventory value by SKU and comparing it with sales velocity. Products with low turnover and high on-hand value are your biggest cost drivers. Use ABC analysis or inventory aging reports to isolate and act on them.
2. What’s a realistic inventory carrying cost percentage for e-commerce?
For most e-commerce and retail brands, 20–25% of average inventory value is normal. Anything above 30% usually signals inefficiencies — excess stock, long lead times, or poor demand planning.
3. How can I reduce carrying costs without risking stockouts?
The key is better forecasting and dynamic replenishment. Use rolling forecasts, update reorder points monthly, and right-size safety stock based on demand variability — not static rules. This maintains service levels while lowering capital lockup.
4. Does increasing order frequency really reduce carrying costs?
Yes — but only if order cost per cycle remains low. Switching from large, infrequent bulk orders to smaller, data-driven replenishments (guided by EOQ) keeps stock fresher and lowers storage and insurance costs.
5. How do supplier lead times affect my inventory carrying cost?
Long or unreliable lead times force you to carry extra buffer stock, raising costs. Work with suppliers on shorter lead times, flexible MOQs, or vendor-managed inventory (VMI) models to reduce this dependency.
6. Should I include obsolete or dead stock in my carrying cost calculation?
Yes — obsolete and unsellable stock still incurs storage, insurance, and depreciation costs. Identifying and liquidating dead stock early directly reduces carrying cost and frees capital.
7. How can warehouse optimization lower my carrying costs?
By improving space utilization, picking efficiency, and SKU placement, you reduce storage cost per unit. Pairing this with cloud-based visibility tools helps track slow movers and consolidate inventory more efficiently.
8. How do tools like EasyReplenish help reduce inventory carrying costs?
Platforms like EasyReplenish use AI to combine sales velocity, lead time, and demand signals to trigger smart replenishment. This prevents overstocking, automates PO creation, and keeps working capital lean across channels.
Optimize Your Inventory Effortlessly
Receive timely insights and updates to ensure your inventory stays perfectly aligned with demand.


