Boost Sales with Less Inventory: The 5-Step Cheat Sheet
Unlock Cheat Sheet ->
Join our webinar  "3 Costly Inventory Forecasting Mistakes" on Feb 27, 2025, at 2:30 PM BST.
Unlock Cheat Sheet ->
Tag1
Tag1

Inventory Turnover Ratio Explained: Formula, Calculation & Tips

By:Team EasyReplenish
May 29, 2025
6 min read

In today’s competitive business landscape, managing inventory efficiently is not just a back-office task — it’s a strategic advantage. At the heart of this efficiency lies a critical metric: inventory turnover. Whether you’re a retailer juggling thousands of SKUs, a manufacturer balancing production schedules, or an e-commerce entrepreneur aiming to optimize cash flow, understanding inventory turnover can unlock new levels of profitability and operational agility.

But what exactly is inventory turnover? How do you calculate it, interpret the numbers, and most importantly, use it to drive smarter business decisions?

In this comprehensive guide, we’ll break down everything from the inventory turnover formula and how to calculate it, to actionable strategies backed by real-world examples. You’ll gain clarity on why inventory turnover matters, how to benchmark it for your industry, and how leading companies harness this metric to fuel growth and minimize waste.

What is Inventory Turnover? — A Deep Dive

Inventory turnover is a performance metric that measures how many times a company’s inventory is sold and replaced over a specific period, usually a year. In simpler terms, it tracks how fast your products move from stock to customer hands.

However, inventory turnover is much more than just a speedometer of sales — it reflects the health of your inventory management, demand forecasting accuracy, and even your cash flow efficiency. 
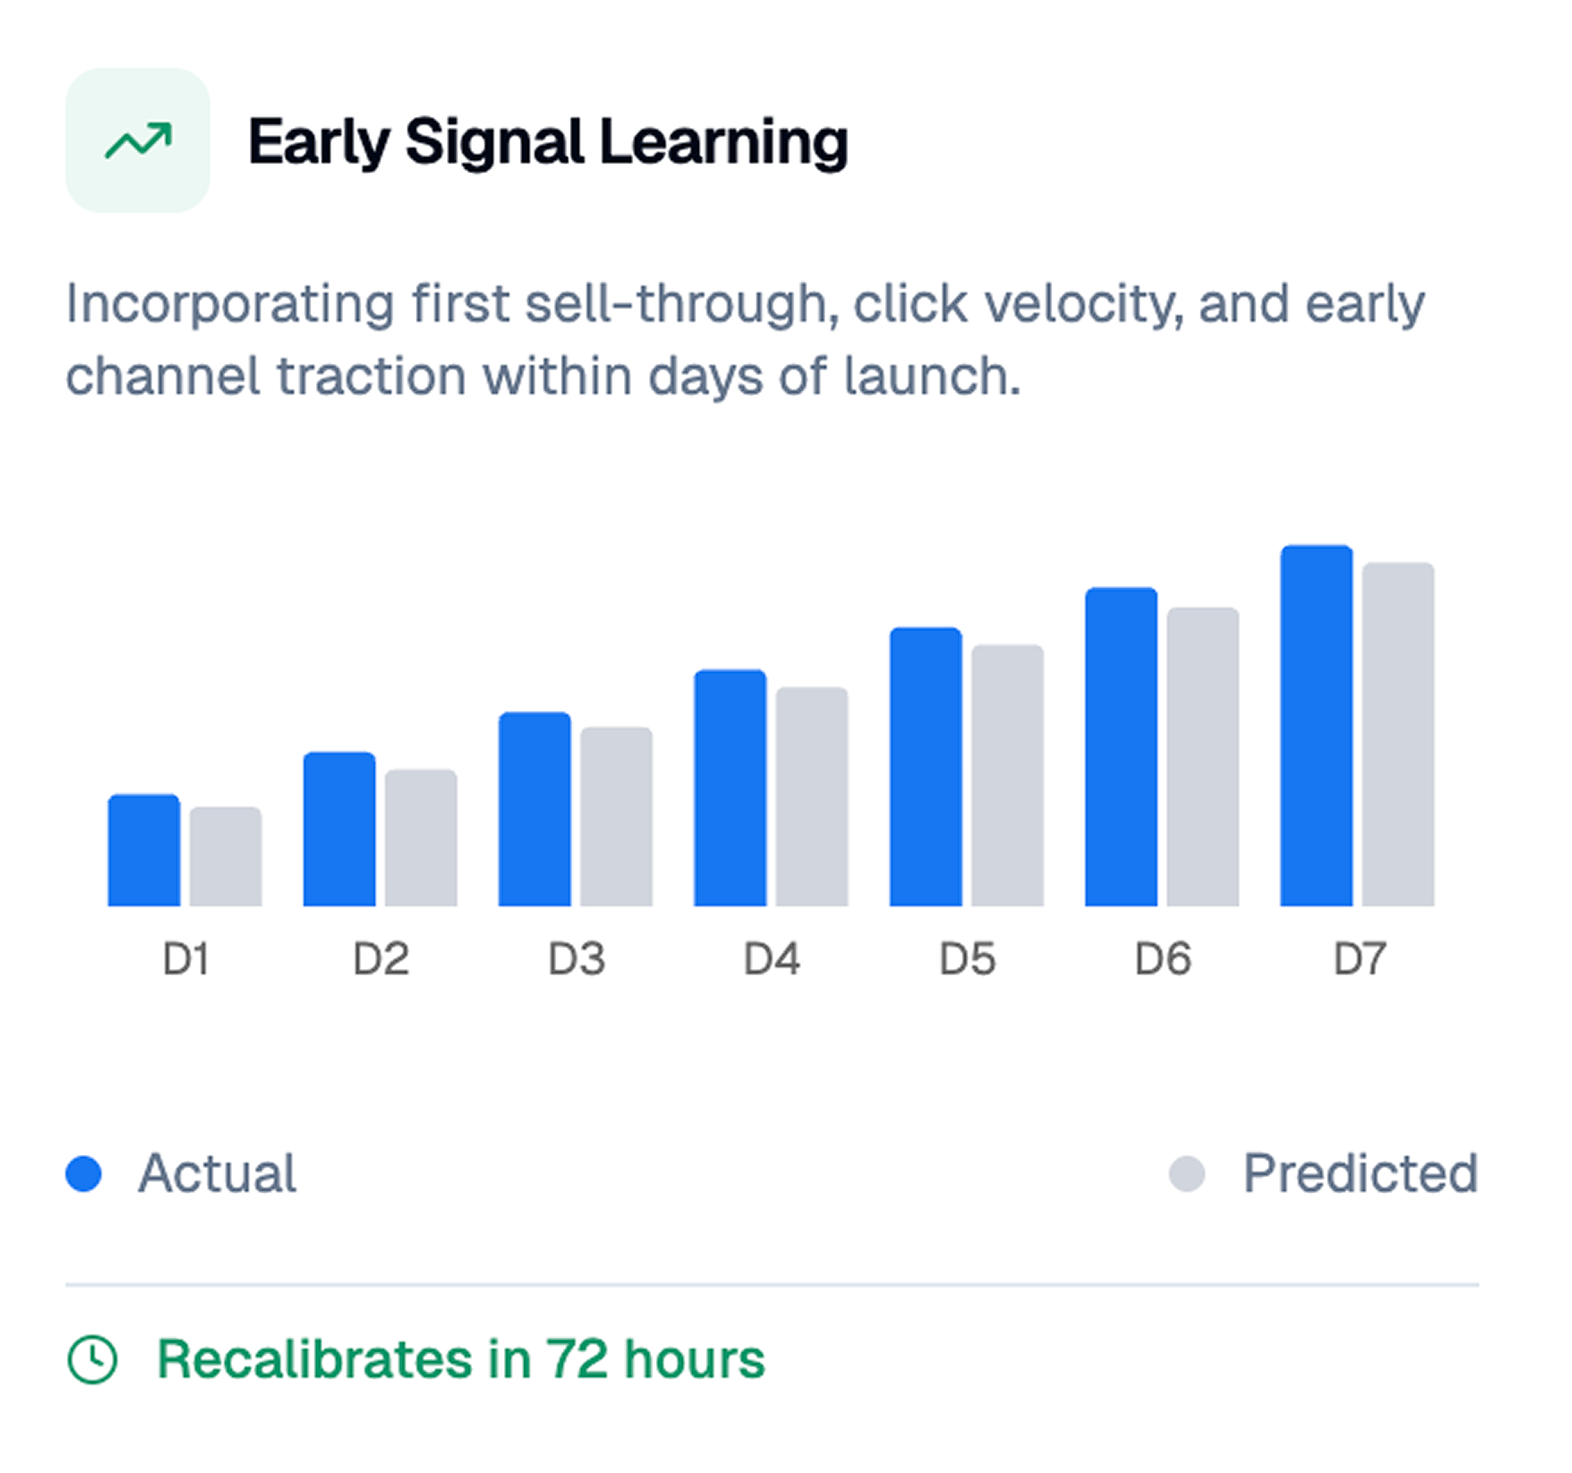
A high turnover indicates strong sales and effective inventory management, meaning you’re not tying up capital in unsold goods. Conversely, a low turnover often signals overstocking, slow-moving products, or declining demand, which can lead to increased holding costs, markdowns, or even obsolescence.

Why does this matter? Because inventory is typically one of the largest assets on your balance sheet, and inefficient inventory can cripple your working capital. For example, a company with $1 million in inventory sitting idle is essentially blocking that money from being used elsewhere — in marketing, product development, or expansion.

It’s also important to recognize that “high” or “low” inventory turnover isn’t inherently good or bad without context. Different industries naturally have varying turnover rates. For instance, grocery stores often have very high turnover due to perishable goods, whereas luxury watchmakers may have lower turnover reflecting the nature of their products.

Common Misconceptions:

  • Inventory turnover is not just about sales velocity; it’s about aligning inventory levels to actual demand.
  • A high turnover rate that causes frequent stockouts can hurt customer satisfaction.
  • Low turnover isn’t always a sign of poor management — sometimes it’s strategic for exclusivity or seasonal goods.


What is Inventory Turnover Ratio?

The inventory turnover ratio is the quantitative expression of inventory turnover. It’s calculated by dividing the Cost of Goods Sold (COGS) by the average inventory during the same period. This ratio gives a clear, numerical representation of how many times inventory cycles through your business.

1. Inventory Turnover Ratio Formula:

Inventory Turnover = Cost of Goods Sold (COGS) ÷ Average Inventory

Where: Cost of Goods Sold (COGS) is the total cost of producing or purchasing the goods sold during the period.

Average Inventory = (Beginning Inventory + Ending Inventory) ÷ 2

This formula is widely used because COGS reflects the direct costs attributable to the production of goods sold, providing a more accurate measure than sales revenue when assessing inventory efficiency.

2. Why use average inventory?

Inventory levels fluctuate throughout the year due to seasonality, promotions, or purchasing cycles. Using the average inventory — typically calculated as (Beginning Inventory + Ending Inventory) / 2 — smooths out these fluctuations, giving a more reliable turnover ratio.

3. Industry Benchmarks:

  • Retail (Apparel/Fashion): Typical turnover ratio ranges from 4 to 8 per year. Fast fashion brands often exceed 8, reflecting rapid inventory cycling.
  • Grocery: Ratios often surpass 20 due to perishable goods and frequent replenishment.
  • Manufacturing: Ratios can be lower, around 3 to 5, depending on production complexity and inventory holding requirements.

4. Interpreting the Inventory Turnover Ratio

A turnover ratio of 6 means the company sold and replaced its inventory 6 times over the period. The higher the number, the more efficiently inventory is being managed — in theory. But context is king:

  • Very high turnover might indicate understocking and potential lost sales.
  • Low turnover suggests excess stock, tying up capital and increasing holding costs.

By tracking this ratio over time, companies can spot trends, optimize purchasing decisions, and align inventory more closely with market demand.

How to Calculate Inventory Turnover — Step-by-Step Guide

Calculating inventory turnover might seem straightforward, but doing it accurately and interpreting the results correctly is what sets savvy inventory managers apart. Let’s walk through the process step-by-step, with examples to clarify each part.

Step 1: Gather Your Data

To calculate inventory turnover, you need two key numbers:

  • Cost of Goods Sold (COGS) for the period (usually a year). This is found on your income statement and represents the direct cost of producing or purchasing the items sold.
  • Average Inventory for the same period. This smooths out inventory fluctuations and is calculated as:

Average Inventory = (Beginning Inventory + Ending Inventory) ÷ 2

If you have monthly data and want a more accurate average, you can calculate the average inventory across multiple months.

Step 2: Apply the Inventory Turnover Formula

Once you have the numbers, plug them into the formula:

Inventory Turnover = COGS ÷ Average Inventory

Step 3: Interpret the Result

The resulting number tells you how many times your inventory was sold and replenished during the period. For example:

  • An inventory turnover of 8 means you sold and replaced your inventory 8 times that year.
  • An inventory turnover of 2 suggests slower movement, indicating inventory may be sitting longer on shelves.


Practical Example: Retail Store

Suppose a clothing retailer has:

  • COGS for the year: $500,000
  • Beginning Inventory: $80,000
  • Ending Inventory: $120,000

Calculate the average inventory:

Average Inventory = (80,000 + 120,000) ÷ 2 = 100,000

Now, calculate inventory turnover:

Inventory Turnover = 500,000 ÷ 100,000 = 5

This means the retailer sold and replenished its inventory 5 times during the year.

Variations in Calculation

  • Using Monthly or Quarterly Data: For seasonal businesses, calculating turnover over shorter periods (like quarters) helps spot trends more precisely.
  • Different Inventory Valuation Methods: The accuracy of COGS and inventory depends on your accounting method (FIFO, LIFO, weighted average). Be consistent for meaningful comparisons.

Data Accuracy Tips

  • Ensure your inventory records are up-to-date and accurately reflect physical stock.
  • Use accounting software or ERP systems for reliable COGS and inventory reporting.
  • Avoid mixing periods (don’t use COGS from one year and inventory from another).

Detailed Inventory Turnover Example for the Fashion Industry

Imagine StyleWear, a mid-sized fashion retailer specializing in seasonal apparel — from casual wear to accessories. Fashion retail is notoriously challenging due to fast-changing trends, seasonality, and the risk of excess unsold stock turning into dead inventory.

Company Data for FY 2024:

  • Cost of Goods Sold (COGS): $3,200,000
  • Beginning Inventory (Jan 1, 2024): $600,000
  • Ending Inventory (Dec 31, 2024): $800,000

Step 1: Calculate Average Inventory

First, calculate the average inventory to smooth out seasonal fluctuations:

Average Inventory = (Beginning Inventory + Ending Inventory) ÷ 2

Average Inventory = ($600,000 + $800,000) ÷ 2 = $700,000

Step 2: Calculate Inventory Turnover

Next, apply the formula:

Inventory Turnover = COGS ÷ Average Inventory

Inventory Turnover = $3,200,000 ÷ $700,000 ≈ 4.57

Step 3: Interpret the Result

An inventory turnover of 4.57 means StyleWear sold and replenished its entire inventory about 4.5 times over the year.
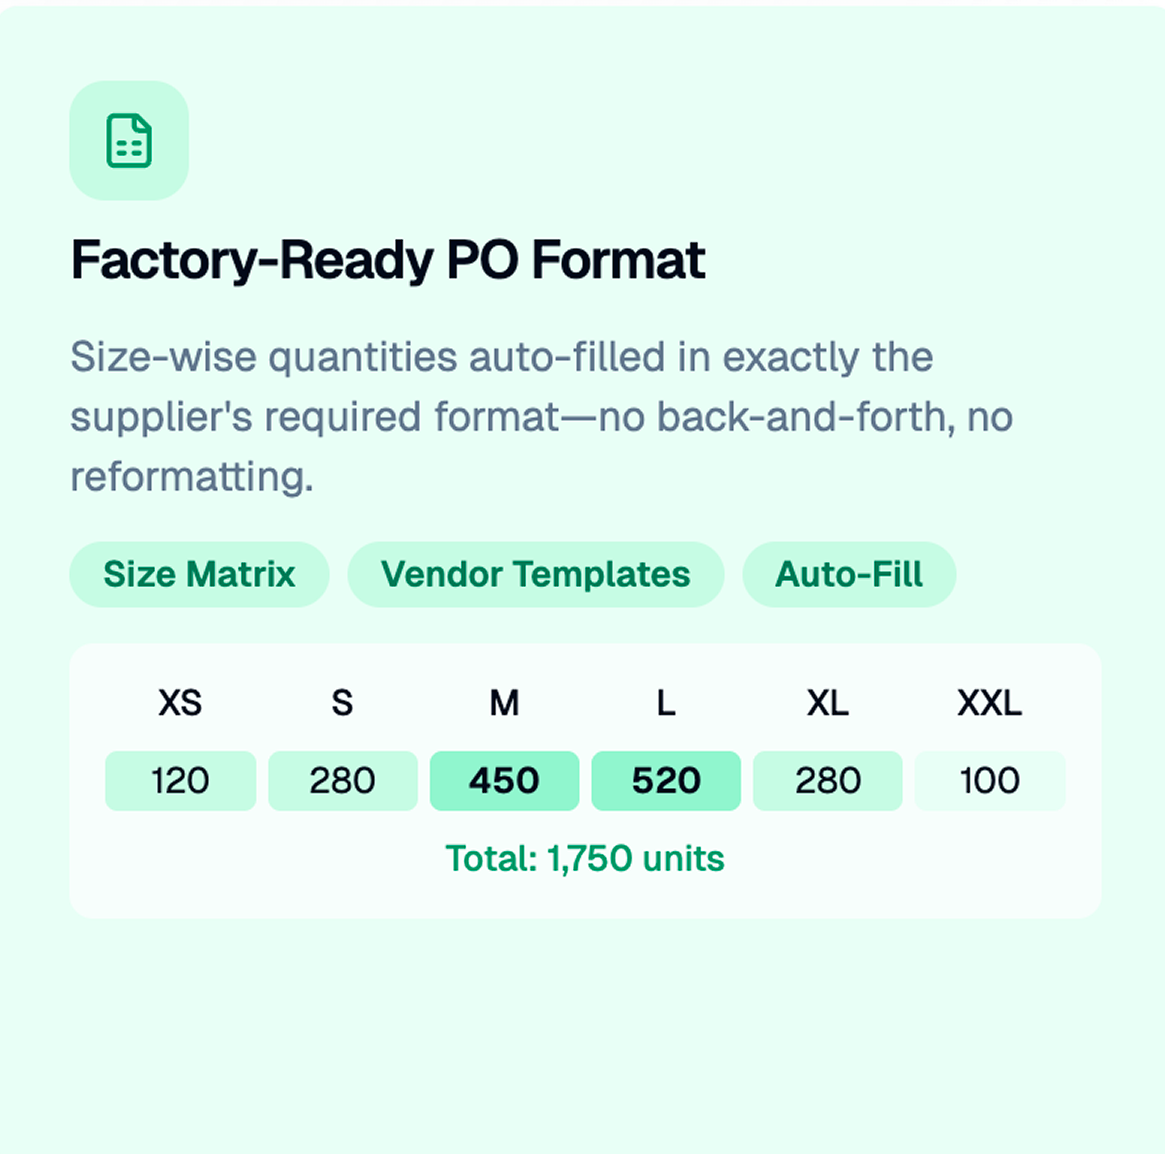
What Does This Mean for StyleWear?

  • Industry Benchmark: Fashion retailers typically aim for an inventory turnover ratio between 4 and 8, depending on market segment. Fast fashion brands like Zara or H&M tend to hit 8 or higher due to rapid product cycles, while premium brands might be lower.

  • StyleWear’s Position: With a turnover of 4.57, StyleWear is within the typical range but on the lower side. This suggests moderate inventory movement — neither too slow to cause excessive holding costs nor extremely fast that risks stockouts.

  • Seasonality & Strategy: Because StyleWear stocks seasonal apparel, turnover may spike during key seasons (spring/summer or fall/winter) and slow down in between. Calculating turnover quarterly could reveal these trends more granularly.

Strategic Recommendations for StyleWear

  • Optimize Replenishment: If StyleWear wants to increase turnover (reduce excess stock), they could improve demand forecasting using sales data analytics and introduce more frequent but smaller purchase orders.

  • Reduce Holding Costs: Slow-moving SKUs should be flagged early for discounting or bundling to avoid markdowns at season’s end.

  • Align With Marketing: Collaborate with marketing to drive promotions on items that risk overstaying on shelves.

  • Leverage Technology: Implement inventory management software with AI-driven recommendations to fine-tune inventory levels per store and region.

Impact on Cash Flow and Profitability

Assuming StyleWear could improve its inventory turnover from 4.57 to 6 in the next fiscal year, the faster inventory cycling would free up working capital tied in stock, allowing reinvestment in new collections, marketing, or store expansion.

Why Inventory Turnover Is Important: Strategic Insights

Understanding and actively managing your inventory turnover ratio is far more than a routine accounting exercise — it’s a powerful tool that directly impacts your bottom line, operational efficiency, and competitive positioning. Let’s explore how businesses leverage this metric in practice and the tangible benefits they gain.

1. Enhancing Cash Flow Management

Inventory represents cash tied up in physical goods. High inventory levels mean more money is locked in stock, which could otherwise fund marketing, R&D, or expansion. By monitoring inventory turnover:

  • Companies identify slow-moving inventory that ties up cash unnecessarily.
  • They optimize purchasing schedules and quantities to keep working capital fluid.
  • Faster inventory turnover accelerates cash conversion cycles, improving liquidity.

Example: A fashion retailer reducing average inventory levels by improving turnover from 4 to 6 can release hundreds of thousands in cash, enabling reinvestment in new collections or digital marketing.

2. Reducing Holding Costs and Waste

Inventory carrying costs include storage, insurance, depreciation, shrinkage, and obsolescence risk. Monitoring turnover helps minimize these costs by:

  • Highlighting slow movers early, so they can be discounted or liquidated timely.
  • Preventing overstocking that leads to spoilage or obsolescence, especially critical in fast-changing sectors like fashion or technology.
  • Encouraging lean inventory practices aligned with actual sales velocity.

3. Improving Demand Forecasting and Procurement

Accurate turnover data feeds into smarter forecasting models:

  • Enables procurement teams to place optimized orders aligned with true market demand.
  • Helps balance product variety and stock levels, avoiding both stockouts and excess.
  • Facilitates dynamic replenishment strategies, adjusting order frequency based on turnover trends.

4. Boosting Customer Satisfaction and Sales

Inventory turnover isn’t only about cost savings — it also influences sales opportunities and customer experience:

  • Maintaining an ideal turnover ratio ensures popular items are consistently in stock.
  • Reduces the risk of stockouts that frustrate customers and drive them to competitors.
  • Supports timely product refresh cycles, keeping assortments fresh and aligned with trends.

5. Benchmarking and Competitive Analysis

Tracking inventory turnover over time and against industry peers allows companies to:

  • Set realistic performance targets and measure progress.
  • Identify operational gaps compared to competitors with more efficient inventory management.
  • Inform strategic decisions such as adopting new technologies, expanding product lines, or adjusting pricing models.

Advanced Tips to Improve Inventory Turnover Ratio

Improving inventory turnover requires more than just tracking numbers—it demands strategic, data-driven actions and cross-functional collaboration. Here are some advanced tips to elevate your inventory management and turn your stock faster:

1. Leverage Data Analytics and AI for Demand Forecasting

  • Use historical sales data, seasonality, and trend analysis combined with AI-powered forecasting tools.
  • Incorporate external factors like market trends, social media sentiment, and economic indicators to predict demand more accurately.
  • Dynamic forecasting helps avoid overstocking and stockouts, aligning inventory with real-time market needs.

2. Implement Just-in-Time (JIT) Inventory Practices

  • Shift towards smaller, more frequent orders to suppliers to reduce holding costs.
  • Maintain strong supplier relationships and agile supply chains for quick replenishment.
  • JIT reduces inventory buildup and minimizes obsolete stock, especially crucial in fast fashion.

3. Optimize Product Assortment with ABC Analysis

  • Categorize products based on their sales value and turnover rate (A = high value/high turnover, B = moderate, C = low).
  • Prioritize inventory investment and shelf space in “A” items while limiting “C” category stock.
  • Regularly review and adjust assortments to reflect customer preferences and market shifts.

4. Enhance Inventory Visibility Across Channels

  • Integrate inventory management across physical stores, warehouses, and online platforms.
  • Use real-time tracking to avoid overstocking in one location and stockouts in another.
  • Omnichannel visibility improves replenishment decisions and customer fulfillment rates.

5. Accelerate Product Lifecycle Management

  • Monitor product performance closely and retire slow movers proactively.
  • Use promotions, bundling, or markdowns strategically to clear excess inventory before new seasons.
  • Shorten product cycles for categories with fast-changing trends, ensuring freshness without overstock.

6. Automate Replenishment and Order Management

  • Set up automated reorder points and alerts based on turnover rates and lead times.
  • Leverage software solutions that adjust orders dynamically as sales fluctuate.
  • Automation reduces manual errors and ensures timely restocking aligned with actual demand.

Final Thought

In fast-paced industries like fashion, mastering your inventory turnover can be the difference between thriving and struggling. By combining accurate calculation, insightful analysis, and strategic action, your business can turn inventory management into a competitive advantage.

Frequently Asked Questions (FAQs) on Inventory Turnover

Q1: How often should a business calculate its inventory turnover?

While annual calculations are common, monthly or quarterly reviews can provide more actionable insights, especially for seasonal or fast-moving industries.

Q2: Can a very high inventory turnover ratio be a bad sign?

Yes. Extremely high turnover might indicate stockouts, which can lead to missed sales and dissatisfied customers. Balance is key.

Q3: How does inventory turnover differ across industries?

Inventory turnover varies widely—for example, grocery stores typically have high turnover due to perishable goods, whereas luxury goods tend to have lower turnover because of longer buying cycles.

Q4: What role does technology play in improving inventory turnover?

Advanced inventory management software, AI-driven forecasting, and real-time tracking enable better demand prediction and stock optimization.

Q5: How can inventory turnover impact supplier relationships?

Consistently accurate turnover data allows businesses to negotiate better terms, improve order timing, and foster collaborative supply chains.

Q6: What are common mistakes to avoid when calculating inventory turnover?

Mixing data from different time periods, ignoring seasonal fluctuations, and inconsistent inventory valuation methods can distort the ratio.

Q7: How does inventory turnover affect financial reporting and taxes?

While turnover itself isn’t directly taxed, it influences inventory valuation and COGS, which affect taxable income and financial statements.

Table of Contents

Optimize Your Inventory Effortlessly

Receive timely insights and updates to ensure your inventory stays perfectly aligned with demand.

CTA Shape ImageCTA Shape ImageCTA Shape ImageCTA Shape Image