Top 15 Inventory Control Software in 2025 : Best Tools Reviewed


Across U.S. non-grocery retail, markdowns destroy more than $300 billion in margin every year, and fashion is consistently the hardest-hit category, with roughly 40% of apparel eventually sold at a discount instead of full price.
That gap between what brands buy and what customers actually want, when and where they want it, is what seasonal inventory planning exists to close. Get it right and a collection sells through near full price. Get it wrong and this season's margin ends up funding next season's clearance rack
This guide breaks down what seasonal inventory planning actually requires: the formulas, benchmarks, and decision points that separate brands with healthy sell-through from brands sitting on dead stock.
Seasonal inventory planning is the process of forecasting demand for products with predictable seasonal buying patterns, then timing purchasing, production, and delivery so the right inventory arrives in the right quantity, location, and moment to maximize sell-through while minimizing excess stock.
In fashion, "seasonal" means more than weather. Demand swings with cultural moments, regional climate variation, and trend cycles that can run their course in a matter of weeks. A single national buy plan (one quantity, one timeline, one assortment for every region) is almost guaranteed to misfire somewhere: warmer markets sell out of lightweight pieces in April while northern stores are still buried in unsold inventory in June.
That's the core tension seasonal planning is built to resolve: predicting not just what will sell, but where, when, and for how long, then building purchasing and allocation around that window before it closes.
Seasonal misjudgment rarely shows up as one line item. It shows up everywhere at once.
[Suggested image: A simple two-bar comparison chart — "Cost of Overstock vs. Cost of Stockouts" — visualizing margin lost to markdowns vs. revenue lost to stockouts.]
The pattern across every one of these data points is the same: both failure modes, too much inventory and too little, trace back to the same root cause. Forecasting and timing weren't tight enough to match supply with the real demand window. That's precisely what a seasonal inventory plan is designed to fix.
So how do you know whether your own seasonal plan is actually closing that gap, rather than just keeping everyone busy? The metrics below taken together are a working answer to that question.
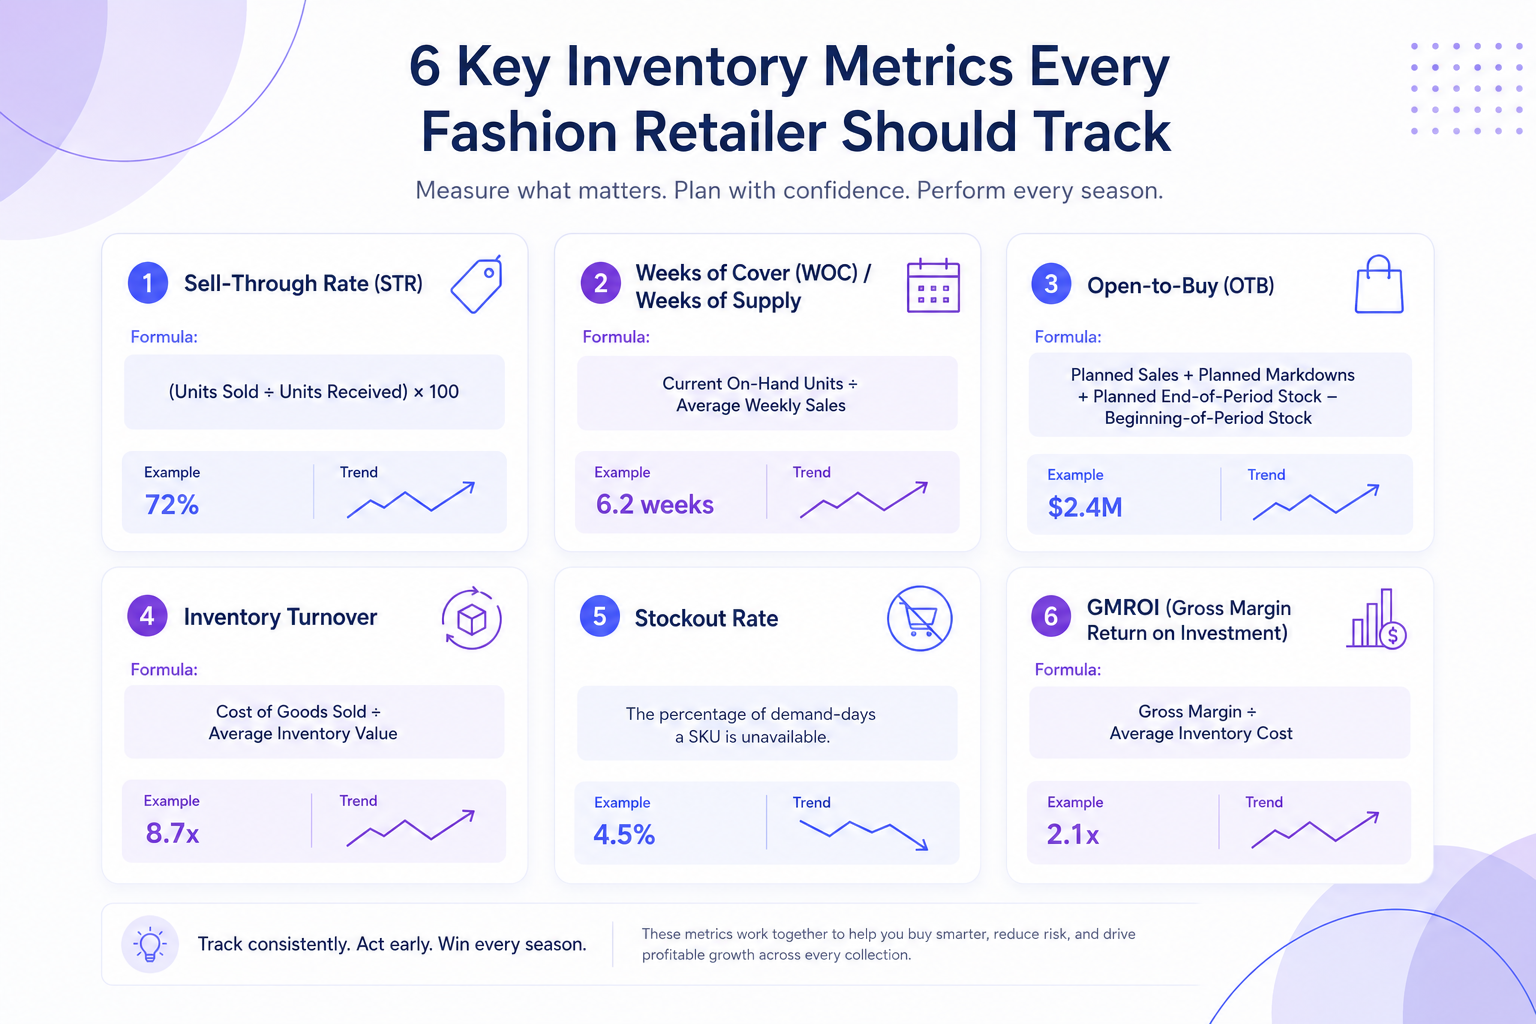
You can't plan what you don't measure. These are the core KPIs that separate data-driven seasonal planning from guesswork.
Formula: (Units Sold ÷ Units Received) × 100
Sell-through rate is the percentage of received inventory that has actually sold within a given period. It's the most-watched fashion inventory metric because a low STR means capital is sitting on shelves, while a very high STR early in the season is a sign you under-bought and risk a mid-season stockout.
Formula: Current On-Hand Units ÷ Average Weekly Sales
WOC tells you how long current stock will last at the current sales pace. If WOC exceeds the number of weeks left in the selling season, that SKU is on track to become overstock. It gives you the signal to act (promote, reallocate, or markdown) before the window closes rather than after.
Formula: Planned Sales + Planned Markdowns + Planned End-of-Period Stock − Beginning-of-Period Stock
OTB is the budget discipline that connects seasonal forecasting to actual purchasing. It caps how much new inventory you can commit to in a given period based on what's already on order, what's already selling, and what stock targets call for. This prevents the common failure of buying ahead of demand simply because a style "feels" right.
Formula: Cost of Goods Sold ÷ Average Inventory Value
Turnover measures how efficiently inventory converts to revenue over a period. Fashion e-commerce typically runs higher (around 10–12x annually) than physical retail, reflecting faster cycles and more frequent promotions.
5. Stockout Rate
The percentage of demand-days an SKU is unavailable. Brands with balanced, well-planned turnover have been shown to lower stockout risk by as much as 18% versus brands managing inventory reactively. (Best Colorful Socks: Fashion Inventory Turnover Statistics)
Formula: Gross Margin ÷ Average Inventory Cost
GMROI answers a profitability question STR can't: not just whether an SKU sold, but whether it sold profitably relative to the capital tied up in it. A style with a strong sell-through rate but thin margins and slow turns can still be a weak GMROI performer.
Six metrics is a lot to hold in your head mid-season. In practice, most of the "am I doing this right?" question collapses into a handful of pass/fail reads against the benchmarks above:
If most of your answers land in the "on track" column, your seasonal plan is doing its job. If two or more land in "problem", especially the same one repeating across seasons, that's usually a sign the gap isn't in the forecast itself but in one of the seven components below: most often allocation, replenishment triggers, or the review loop that's supposed to feed lessons back into the next buy.
Once you have demand forecasts, the seasonal purchase quantity follows a straightforward formula:
Forecasted Demand + Safety Stock − Existing Inventory = Seasonal Purchase Quantity
Worked example: A brand forecasts demand for 1,000 units of a linen co-ord set for the season, wants a safety stock buffer of 100 units to cover forecast error, and currently holds 50 units of carryover stock. The seasonal purchase quantity is 1,000 + 100 − 50 = 1,050 units.
The forecasted-demand figure itself should be built bottom-up — by SKU, size, color, and region — rather than as a single national number, since a single average tends to mask the regional and variant-level swings that drive most fashion stockouts and overstock.
Each of these connects to the next . Skip one and the whole plan loses its footing.
1. Trend Forecasting and Line Planning. Everything starts with anticipating what will sell: analyzing prior-season performance, market signals, and trend forecasts, then translating that into a range architecture of categories, silhouettes, colors, and price points.
2. Pre-Season Demand Planning. Forecasting expected sales at SKU, category, and regional level using historical data and current market indicators. This defines buy depth - how much of each style to commit to before the season starts.
3. Merchandise Buying Calendar. A calendar structuring buying decisions against supplier lead times, production buffers, and delivery windows. No forecast succeeds if inventory physically arrives after the demand window closes.
4. Allocation and Channel Strategy. Distributing inventory by location and channel (retail, DTC, wholesale, marketplace) based on regional demand, climate, and past performance. This is where the "warmer states sell out, colder states overstock" problem gets solved or repeated.
5. In-Season Replenishment Strategy. Setting reorder triggers, reserving supplier capacity, and tracking early sell-through to inform rebuys on winning SKUs.
The best-performing styles in a season are rarely the ones you predicted with full confidence pre-season. Salty, a fast-growing jewelry and accessories brand managing 6,500+ active SKUs across eight categories, raised bestseller availability from 78% to 97% and cut bestseller stockouts by 19% within five weeks by replacing manual SKU analysis with in-stock daily-rate-of-return tracking and ABC-classified reorder triggers.
6. End-of-Season Exit Strategy. A defined markdown schedule, promotional calendar, and decision tree for which SKUs get cleared, carried over, or reworked. Without a plan in advance, exit decisions get made reactively and at worse margins.
7. Inventory Performance Review Loop. Post-season analysis of what sold, what didn't, and why: by style, size, region, and delivery date. This is the step that compounds. Each season's review should make the next season's forecast more accurate.
Seasonal demand is inherently harder to forecast than steady-state demand: the selling window is short, history from prior years isn't always a reliable guide (trends shift), and a forecasting miss can't always be corrected mid-season the way it can for a year-round staple.
That's exactly why safety stock matters more here, not less.
Reorder point formula: (Average Daily Sales × Lead Time in Days) + Safety Stock
For fashion specifically, safety stock is based on:
Rather than eliminate forecast error, the goal is to size the buffer so a forecast miss doesn't become a missed season.
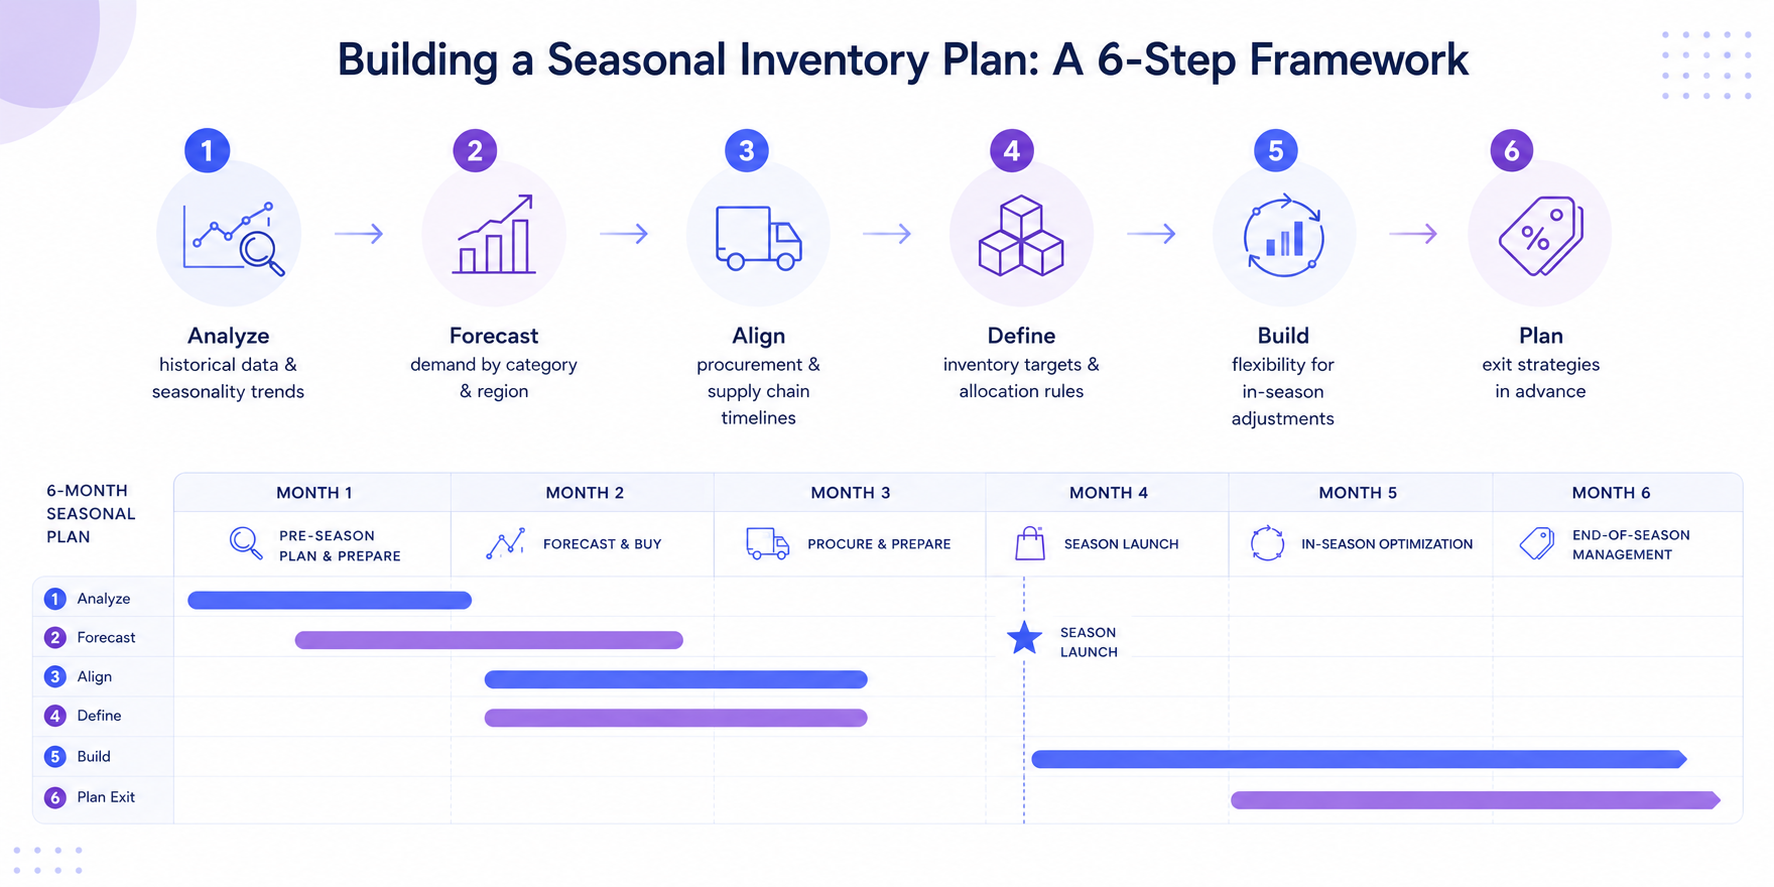
Step 1: Analyze historical data and seasonality trends.
Review what sold, what underperformed, how promotions affected velocity, and when peak demand actually occurred last season.
Pro tip: Segment this analysis by region and channel, not just by SKU: a style that "underperformed" nationally may have sold out in three states and flopped everywhere else.
Step 2: Forecast demand by product category and region.
Build forecasts at the SKU, category, and geography level, adjusted for current assortment changes, business goals, and external factors like climate.
Pro tip: Treat new styles and carryover styles differently. Carryover items have sales history to forecast from; new styles need an attribute-matching approach (see the AI section below).
Step 3: Align procurement and supply chain timelines.
Reverse-engineer purchasing dates from supplier lead times, production windows, and shipping durations, with buffers built in for high-risk or unpredictable SKUs.
Pro tip: Build the largest buffers around your highest-velocity, hardest-to-reorder styles. That's where a stockout costs the most in lost revenue.
Step 4: Define inventory targets and allocation rules.
Set opening stock levels and allocation logic based on past sell-through, store size, channel velocity, and regional demand variability.
Pro tip: Document the allocation rule itself (e.g., "warmer-climate stores receive 1.5x base allocation"), not just the resulting numbers. Rules are reusable next season; one-off numbers aren't.
Step 5: Build flexibility for in-season adjustments.
Monitor sell-through in real time and prepare to shift inventory or trigger reorders as SKUs over- or under-perform.
Pro tip: Set the reorder trigger threshold before the season starts (e.g., "reorder when WOC drops below 3"), so the decision is mechanical, not a mid-season debate.
Step 6: Plan exit strategies in advance.
Decide your approach to end-of-season inventory (markdown, bundle, carry forward, or liquidate) before the season ends, not after.
Pro tip: Tie markdown timing to WOC thresholds, not calendar dates. An SKU with a 12-week WOC in week 2 of an 8-week season needs intervention immediately, regardless of what the markdown calendar says.
Demand uncertainty tiers help teams match buying risk to demand confidence. This discipline prevents every seasonal SKU from being treated the same.
Use three simple tiers.
Low uncertainty includes proven carryover styles, evergreen colors, reliable size curves, stable price points, strong history, flexible replenishment, and low markdown exposure.
Medium uncertainty includes familiar categories with a new color, material, gemstone, supplier, price point, region, or channel.
High uncertainty includes new silhouettes, trend-led products, influencer-dependent drops, experimental colors, high price points, long lead times, rigid MOQs, limited reorder options, or high markdown exposure.
Classify each SKU using these questions:
Planning rules should follow the tier.
Low-uncertainty SKUs can support deeper pre-season buys, broader allocation, and higher service levels. Medium-uncertainty SKUs should use controlled depth, phased receipts, and early checkpoints. High-uncertainty SKUs should rely on test buys, limited drops, smaller launch quantities, fast reorder options, supplier reservations, or marketing-gated tests.
This belongs in the plan because it connects creativity with control. Merchandising can test newness without letting experimental stock dominate the buy.
It also gives finance a clearer view of downside risk. Forecast confidence becomes linked to OTB, allocation, replenishment, and markdown strategy.
Fashion carries a layer of complexity most other retail categories don't:
This is also where AI-based forecasting earns its keep over spreadsheet-based methods.
Traditional forecasting in apparel leans heavily on historical sales data. That approach breaks down precisely where fashion is hardest: new styles with no sales history, fast-shifting trends, and SKU-level granularity that a spreadsheet can't realistically hold.
AI-driven forecasting addresses these gaps directly:
The practical shift is less about replacing buyer judgment and more about giving it better inputs: continuously updated forecasts instead of static pre-season numbers, and SKU/size/color-level predictions instead of a single style-level average.
This plays out concretely at brands managing high SKU counts and frequent new launches. Alamode, a fast-fashion e-commerce brand with 18,500+ active SKUs across eight categories, struggled to forecast newly launched styles because it had no reliable in-stock sales-rate data to work from and manual inventory analysis took up to three hours each time. After implementing automated, attribute-based stocking estimates, that analysis time dropped to minutes
The principles of seasonal inventory planning hold regardless of how a brand sells, but the constraints, lead times, and risk profile differ enough that the same plan can't be executed the same way in both models.
Bottom line: DTC brands trade lower planning complexity for higher inventory risk; multi-channel retailers trade lower inventory risk for higher coordination complexity. Either way, the planning discipline — forecasting, allocation, in-season monitoring, exit strategy — is the same; only the constraints differ.
Real-World Proof: Fashion Brands That Closed the Gap
The scenario above is a teaching composite. Here are some real, named brands that have moved their numbers by adjusting their inventory planning strategy.
The pattern is the same across all three: the underlying problem was never a lack of effort. It was forecasting and replenishment decisions being made manually, at the style level, after the fact. Moving that decision-making to the SKU level and making it systematic is what moved the numbers.
Seasonal inventory planning is the mechanism that decides whether a collection protects full-price sell-through or quietly funds next season's clearance rack. And, the brands narrowing that gap aren't doing it with better instincts; they're doing it with tighter metrics, SKU-level forecasting, and a review loop that gets sharper every season.
Start with one number: calculate your sell-through rate for last season's SKUs, then build this season's buy plan around what it tells you.


.png)
