Best Mobile Inventory Management Software: Features & Benefits


Every fashion founder has been sold the same story. Buy better forecasting software, hire a data analyst, build smarter Excel models, and your inventory problems will vanish. So you spend months refining your forecast accuracy from 65% to 78%, congratulate the team, and then watch the same thing happen again.
Bestsellers go out of stock in week three. Slow movers pile up by week eight. Cash gets locked in dead stock. Sales get lost to stockouts on the SKUs that were actually working.
In fashion, even a forecast that looks statistically respectable still breaks the business. Not because the math is wrong, but because the business does not behave like the math expects. A 75% accurate forecast still misses one in four SKU decisions, and in fashion those misses cluster around the styles that matter most.
The same volatility that makes fashion exciting on the demand side makes it impossible to predict at the SKU level.
Fashion has volatility baked into every layer. A single style has six sizes and four colors, which means twenty four SKUs from one design. Trends shift in weeks, not seasons. Returns change your real stock position daily. A reel goes viral and one color outsells the other five combined. Your forecast did not predict that. No forecast could.
The gap that actually hurts you is between when a signal appears in your sales data and when stock arrives back on your shelf. Most founder led brands operate on weekly Excel reviews.
By the time you spot the trend, react, raise a PO, and wait for production, three weeks have passed. The trend is dead. The opportunity is gone. The stock arrives just in time to become next quarter's markdown.
Most of this latency comes from one place. The entire planning process lives in a spreadsheet on the founder's laptop. One person updates it, one person reviews it, one person approves reorders. When that person is in meetings or travelling, the system stops. Excel is not the villain. The dependence on a single human bottleneck is.
Forecast accuracy and business outcomes have almost no correlation in fashion. Brands with mediocre forecasts but fast reaction loops outperform brands with great forecasts and slow loops. Every single time.
Walk into any well run direct to consumer fashion brand doing 20 crore and above, and you will not find a forecasting genius. You will find a replenishment system.
They do not chase perfect predictions. They built a different kind of operation. They replenish frequently, sometimes weekly for top SKUs. They use guardrails like minimum stock levels and maximum cover weeks instead of trying to predict the future. They react to demand signals daily, not quarterly. They treat the forecast as a rough starting point, not a target.
Take a brand in the Indian women's wear space that scaled from 5 crore to 40 crore in eighteen months. Their secret was not a better forecast. It was a 7 day reorder cycle on their top 20% SKUs and a brutal kill rule on anything that did not move in 21 days. They were wrong about demand half the time. They just corrected faster than anyone else.
That is the model worth copying.
Here is the mental shift that changes everything.
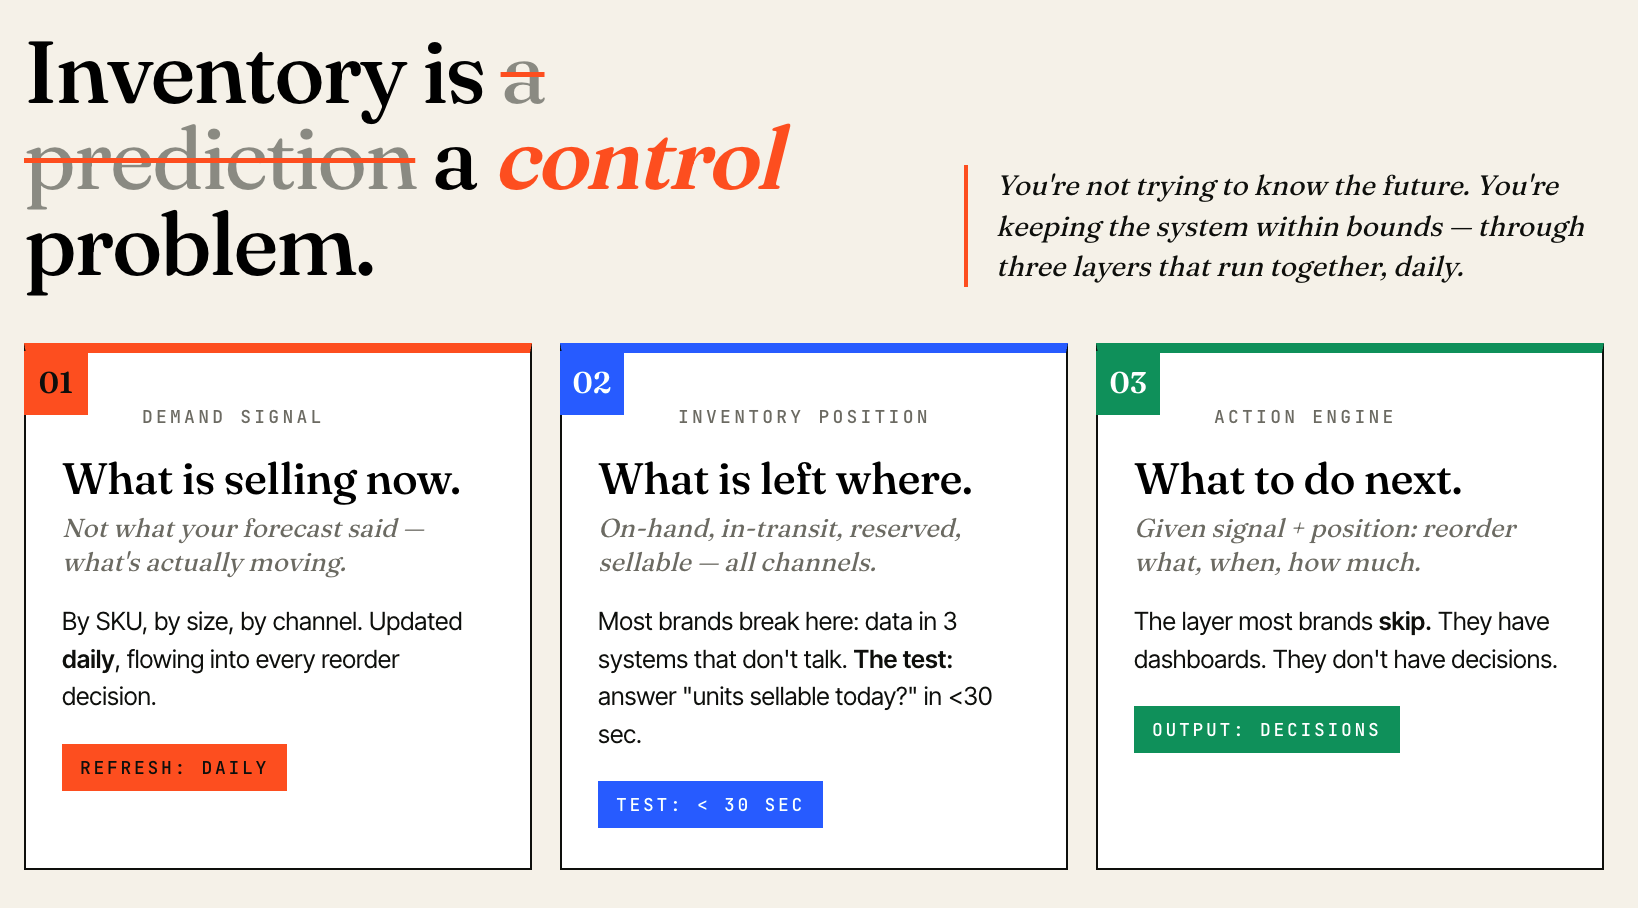
Inventory is not a prediction problem. It is a control problem.
You are not trying to know the future. You are trying to keep the system within acceptable bounds at all times. That is a fundamentally different game, and it breaks into three layers that work together.
The first layer is the demand signal. What is actually selling right now, this week, by SKU, by size, by channel. Not what your forecast said would sell. What is selling? This signal should update daily and flow into every reorder decision you make.
The second layer is inventory position. What stock you have, where it sits, what is in transit, what is reserved, what is actually available to sell. Most brands get this wrong because their inventory data lives in three systems that do not talk.
Until you can answer the question "how many units of SKU X are sellable today across all channels" in under thirty seconds, this layer is broken.
The third layer is the action engine. Given the signal and the position, what should you reorder, when, and how much. This is the layer most brands skip entirely. They have dashboards. They do not have decisions.
When all three layers run together on a daily cadence, forecasting becomes almost irrelevant. The system corrects itself.
If you remember nothing else from this article, remember these five rules. They are the operating system of every fashion brand that does not drown in dead stock.
Rule 1. Replenish fast movers weekly. Your top 20% of SKUs drive 70 to 80% of revenue. They deserve their own reorder cadence. Not monthly. Not whenever someone notices. Weekly, with automated triggers.
Rule 2. Kill slow movers early. If an SKU has not moved meaningful units in 21 to 30 days, do not wait. Mark it down, push it to outlet channels, or write it off. The longer you hold, the more cash you bury.
Rule 3. Buy depth, not width. Most founders add new styles every drop because variety feels like growth. It is not. Depth on proven winners outperforms width on unproven styles by a wide margin. Fewer SKUs, more units per SKU, faster turns.
Rule 4. Allocate by channel performance. Your Shopify store, Myntra, Ajio, and offline outlets all sell differently. The same SKU performs three times better on one channel than another. Allocate stock based on where it actually sells, not equally.
Rule 5. Never let top SKUs go out of stock. A stockout on a hero product is not just lost revenue today. It is lost ranking on marketplaces, lost ad performance, lost customer trust. Build a buffer logic that triggers reorders before stock runs dry, not after.
Layered on top of these rules, you need a few systems to make them work in practice.
Automated reorder recommendations that compute suggested quantities daily based on sell through, cover weeks, and lead time. SKU level logic that respects size and color depth, because a stockout on size M is not the same as a stockout on size XS.
Channel aware allocation that decides not just how much to reorder, but where to send it. PO automation that lets you approve and dispatch reorders in minutes rather than hours.
The before and after looks like this. Manual operation means a weekly chaos meeting where five people argue about what to reorder based on gut feel and a stale Excel file.
Automated operation means a daily report with reorder suggestions, a 15 minute review, and PO out the door by 11am.
Stop tracking forecast accuracy. It is a vanity metric for fashion. Replace it with five operational metrics that actually drive cash and sales.
What percentage of your hero products are available to sell right now. Target 95% plus. Anything less and you are bleeding revenue on the styles that matter most.
Of the stock you bought in the last drop, how much has sold. This tells you whether your buying is calibrated to actual demand. Low sell through means you bought too wide or too deep on the wrong styles.
How many weeks of forward demand your current stock represents. Too low means stockout risk. Too high means cash locked up. Healthy range is usually 4 to 8 weeks depending on category and lead time.
What share of your inventory has not moved in 60 plus days. This is the silent killer. Most brands do not measure it until cash flow gets tight, by which point you are sitting on lakhs of buried capital.
Estimate the units you would have sold on out of stock SKUs based on their pre stockout velocity. This number, more than any other, shows you the real cost of slow replenishment.
These five metrics, reviewed weekly, tell you more about your inventory health than any forecast accuracy number ever will.
Here is a four week plan to actually do this. No theory. Just sequence.
Week 1. Clean your SKU and inventory data. Get one source of truth across your warehouse, Shopify, and marketplace listings. Identify your top 20% SKUs by revenue. This is your priority list for everything that follows.
Week 2. Set reorder rules for those top SKUs. Define minimum stock levels based on lead time and daily velocity. Define maximum cover weeks so you do not overbuy. Document the logic so it does not live in one person's head.
Week 3. Start automated replenishment cycles. Run the reorder calculation daily. Review weekly. Send POs on a fixed cadence so your suppliers know what to expect.
Week 4. Measure and refine. Track the five metrics above. Adjust your min and max levels based on what you see. Expand the system to your next 20% of SKUs.
By week six, you will have a replenishment engine. By week twelve, the difference in cash flow and sell through will be obvious in your P&L.
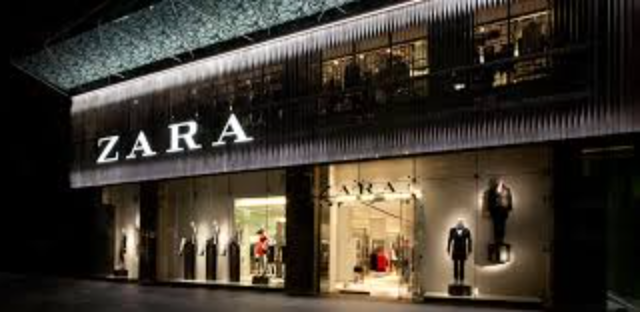
For a real example of what control beats prediction looks like at scale, look at Zara. Not as a customer success story, but as an operating model documented by Harvard Business School for over two decades.
Zara's parent Inditex runs over 6,000 stores across 80+ countries and produces around 840 million garments a year. Predicting demand at that scale should be impossible. So they stopped trying. They built the fastest replenishment loop in fashion instead.
Only 15% to 25% of a Zara line is designed ahead of the season, and over 50% of items are designed and manufactured mid season based on what becomes popular. H&M commits roughly 80% ahead of the season. Most traditional retailers commit close to 100% and discount the misses heavily.
Zara orders very small initial batches, sometimes as few as 4 to 6 units of a shirt per store. Stores receive replenishments twice a week, with quantities tailored to real time SKU level sales from that specific store. RFID tagging alone made their inventory counting 80% faster.
The result is the leanest year end inventory in the industry despite carrying 11,000 distinct items per year, against 2,000 to 4,000 for competitors. Inditex grew over 220% in annual revenue between 2004 and 2016, outpacing H&M, Gap, and Banana Republic.
The takeaway is not that you need RFID or a data center. It is the operating principle. Small initial bets. Fast signal capture. Frequent replenishment. Decisions made at the SKU and store level, not the season level. That principle scales down to a 5 crore brand on Shopify just as cleanly as it scales up to Inditex.


.png)