
.png)
Smart Replenishment for Fashion Brands: Beyond Forecast Accuracy


If you can’t measure it, you can’t improve it — and nowhere is this truer than inventory. For e-commerce brands, stockouts kill sales, overstocks drain cash, and inaccurate records frustrate customers. The only way to stay in control is by tracking the right inventory KPIs.
Inventory KPIs are the numbers that reveal how efficiently your stock is managed, how much cash is tied up in products, and whether you’re meeting customer demand without waste. In this guide, we’ll cover the most important KPIs for inventory management, highlight those specific to e-commerce, and share practical examples you can start using today to spot problems early and scale smarter.
Inventory KPIs (Key Performance Indicators) are measurable values that show how effectively a business manages its stock. Unlike generic metrics that only capture raw numbers, KPIs connect directly to decision-making — helping you identify inefficiencies, control costs, and improve customer satisfaction.
The difference lies in actionability. For instance, simply tracking total stock on hand is a metric — it tells you how much product you own. But monitoring inventory accuracy as a KPI shows whether your recorded stock matches what’s physically available, which directly impacts order fulfillment speed and error reduction.
In short: metrics describe; KPIs guide decisions. That’s why focusing on the right KPIs is essential to scaling inventory operations without waste or guesswork.
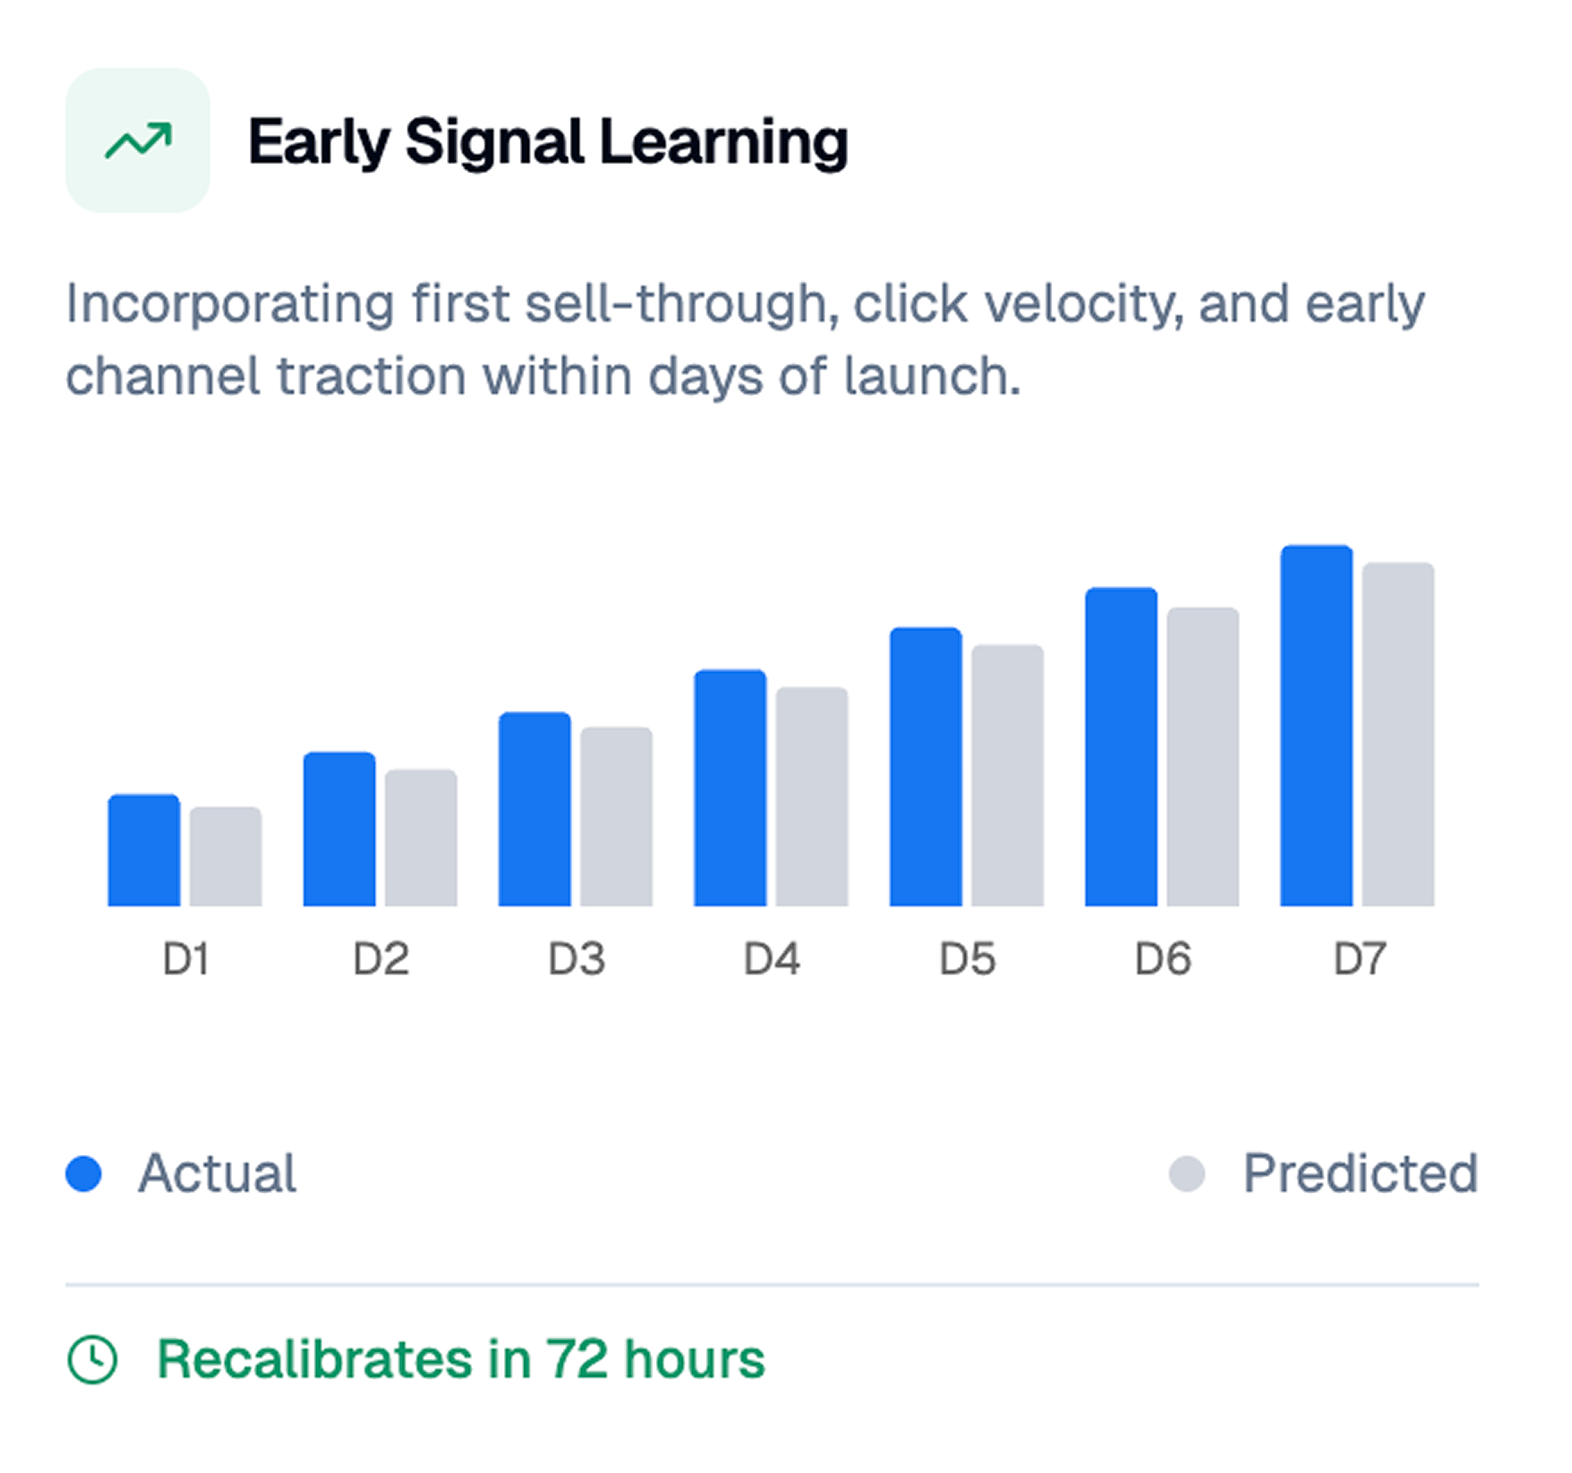
Style levelSell-through with OOS days —
adjusted,Gross margin, ageing etc.
What it is: This KPI measures how closely your recorded stock levels in the system match the actual physical stock in your warehouse(s).
Why it matters: In ecommerce, even a small mismatch between system data and actual inventory can create a ripple effect — overselling on marketplaces, disappointing customers with canceled orders, and wasting time on manual reconciliations. High inventory accuracy ensures trust in your numbers, which means you can confidently run automated replenishment, sync across multiple channels, and scale without constant firefighting.
Example: A fashion brand selling on Shopify and Amazon lists 200 units of a limited-edition jacket. The warehouse count, however, shows only 180. Without tracking accuracy as a KPI, the business oversells, leading to 20 canceled orders and negative reviews. By monitoring accuracy and tying it to cycle counts and barcode scans, the brand raises accuracy from 90% to 99.5%, restoring trust in its system and preventing costly fulfillment errors.
What it is: Inventory turnover shows how many times stock is sold and replaced during a specific period. Formula: Cost of Goods Sold ÷ Average Inventory.
Why it matters: Turnover tells you if your products are moving at the pace you expect. A healthy turnover means your cash is flowing back into the business quickly, reducing storage costs and the risk of obsolete stock. A low turnover highlights problem SKUs that may be draining capital and warehouse space.
Example: A D2C beauty brand calculates its annual turnover for face creams at 8 (fast-moving) while its luxury perfume line sits at 2 (slow-moving). Instead of overstocking perfumes, the brand adjusts purchase orders to match demand and allocates more budget toward fast-moving SKUs. This KPI helps them reallocate working capital, improving profitability without adding new revenue streams.
What it is: DII calculates the average number of days an item remains in stock before being sold. Formula: 365 ÷ Inventory Turnover Ratio.
Why it matters: For ecommerce, DII provides a clear picture of how efficiently stock is being used. If products sit too long, they eat into cash flow, rack up storage costs, and risk markdowns. A shorter DII means your products are moving quickly, boosting liquidity and enabling faster reinvestment in marketing or product development.
Example: An online sneaker retailer discovers its flagship running shoes average 30 DII, but seasonal boots linger for 120 days. Instead of carrying large boot inventories, they cut purchase volumes and run limited seasonal drops, reducing holding costs by 20%. Monitoring DII gave them a data-backed reason to shift from bulk buying to leaner, demand-driven replenishment.
What it is: The percentage of times an item is out of stock when a customer tries to purchase it.
Why it matters: Stockouts don’t just cost immediate sales — they damage customer trust, reduce marketplace rankings, and push buyers to competitors. For ecommerce brands juggling multiple sales channels, this KPI directly reflects how well replenishment planning and demand forecasting are working.
Example: A D2C supplement brand notices a 12% stockout rate for its best-selling protein powder. By setting automated reorder points and adjusting safety stock, the brand cuts the stockout rate to 3%. The result: 15% more repeat purchases and higher lifetime value from loyal customers.
What it is: The total cost of holding inventory, including storage, insurance, depreciation, and opportunity cost. Usually expressed as a percentage of inventory value.
Why it matters: Carrying costs silently erode profitability. In ecommerce, especially with seasonal goods or fast-fashion SKUs, holding costs can quickly outpace margins if stock doesn’t move. Monitoring this KPI helps brands optimize order quantities and free up capital tied in slow movers.
Example: An apparel brand calculates carrying costs at 28% of inventory value due to warehouse fees and unsold seasonal stock. By using demand forecasting and negotiating faster supplier lead times, they reduce carrying costs to 18%, saving nearly $50,000 annually.
What it is: The average time it takes to fulfill an order — from when a customer places it to when it’s shipped.
Why it matters: Customers expect rapid fulfillment, especially on platforms like Amazon where same-day or next-day delivery sets the standard. A shorter order cycle time boosts satisfaction, reduces cancellations, and strengthens brand reputation.
Example: An ecommerce electronics store tracks its average order cycle time at 72 hours. By implementing barcode scanning and warehouse automation, they cut it to 36 hours. Customer satisfaction scores improved, and repeat orders grew by 20% within three months.
What it is: A profitability ratio that measures how much gross margin is earned for every dollar invested in inventory.
Why it matters: For ecommerce, GMROI highlights whether your products are actually generating enough return relative to the cost of carrying them. A low GMROI signals that even though products are moving, they may not be profitable after storage, shipping, and returns.
Example: A fashion retailer tracks GMROI across product categories and finds accessories deliver a GMROI of 3.5 while shoes deliver only 1.2. They reallocate purchasing budget toward accessories, boosting overall inventory profitability without increasing storage costs.
What it is: The percentage of customer orders that can be fulfilled directly from available stock without delay or backorder.
Why it matters: A high fill rate reflects how effectively your inventory is aligned with demand. In ecommerce, a low fill rate means more backorders, longer shipping times, and higher cancellation rates. This KPI ties directly to customer experience and revenue retention.
Example: An electronics brand’s fill rate drops to 82% during holiday season. By integrating real-time demand forecasting and supplier alerts, they increase it to 96%. This directly improves customer satisfaction scores and reduces costly expedited shipping to cover shortages.
What it is: The percentage of sold items that customers return.
Why it matters: High return rates eat into profit margins and can signal poor inventory quality, inaccurate product descriptions, or mismatched demand planning. For ecommerce brands, monitoring return rates per SKU helps pinpoint problem products and optimize listings.
Example: A home décor brand notices that one lamp has a 25% return rate, far above the category average of 5%. By updating the product description and photos to better reflect the size and color, they cut returns in half — saving both shipping and restocking costs.
What it is: The percentage of orders delivered without any issues — meaning on time, in full, with the right items, and damage-free.
Why it matters: In ecommerce, even a small slip (wrong size, late delivery, damaged packaging) can lead to poor reviews and repeat business loss. Perfect Order Rate consolidates multiple aspects of order quality into one benchmark.
Example: An apparel brand has a perfect order rate of 88%. By automating pick-and-pack with barcode scanning, they cut mis-picks by 40%, raising the KPI to 95% and directly improving customer satisfaction scores.
What it is: The percentage of customer orders that cannot be fulfilled at the time of purchase and are placed on backorder.
Why it matters: A high backorder rate often points to weak forecasting or poor replenishment planning. In ecommerce, backorders can quickly turn into cancellations, reducing revenue and eroding brand trust.
Example: A skincare D2C brand notices their backorder rate jumps to 12% whenever they run influencer campaigns. By connecting marketing data with inventory planning, they forecast better and reduce backorders to under 3%.
What it is: The percentage of inventory lost due to theft, damage, miscounts, or fraud.
Why it matters: Shrinkage directly reduces available stock and inflates carrying costs. For ecommerce businesses scaling warehouses or working with 3PLs, monitoring shrinkage helps spot inefficiencies and accountability gaps.
Example: A lifestyle goods brand finds shrinkage at one warehouse is 4%, compared to 1% at others. Investigating further, they identify poor packaging and higher damage rates during inbound handling. Switching vendors reduces shrinkage to industry standard levels.
Style levelSell-through with OOS days —
adjusted,Gross margin, ageing etc.
What it is: The percentage of inventory sold versus the amount received from suppliers during a given period.
Why it matters: A higher sell-through rate signals healthy demand alignment, while a lower rate may indicate overstocking or poor product-market fit. For ecommerce, this KPI helps identify which SKUs deserve more shelf space (or ad spend) and which should be discounted.
Example: A footwear D2C brand sees a 70% sell-through on its latest sneaker line within 45 days. Meanwhile, another SKU stagnates at 30%. They double down on paid ads for the fast mover and run clearance on the slow mover, improving cash flow.
What it is: The average number of days current stock will last before running out, based on sales velocity.
Why it matters: DOH provides a real-world view of how lean (or bloated) your inventory is. Too high = cash tied up. Too low = stockouts and lost sales. Ecommerce brands can use DOH to balance efficiency with service levels.
Example: A skincare ecommerce brand maintains an average DOH of 40. When DOH rises to 90 for a specific serum, they know replenishment was overestimated. They respond with bundling campaigns and influencer partnerships to bring turnover back on track.
What it is: A ratio comparing inventory levels to actual sales for a specific period.
Why it matters: It’s a straightforward KPI for spotting whether inventory is aligned with sales demand. High ratios signal overstocking risks; low ratios may suggest stockouts are imminent.
Example: A fashion retailer tracks a 3:1 stock-to-sales ratio for dresses during off-season, signaling slow movement. They adjust by reducing incoming PO quantities and offering seasonal discounts, bringing the ratio closer to 1.5:1 in-season.
What it is: Measures the profit generated for every dollar invested in inventory. Formula: Gross Margin ÷ Average Inventory Cost.
Why it matters: High sales volume alone isn’t enough — GMROI ensures your inventory is generating real profit. Ecommerce brands can use this KPI to identify SKUs that sell well but don’t contribute enough margin, guiding purchasing and pricing decisions.
Example: A D2C accessories brand finds its best-selling phone cases have a GMROI of 4, while designer wallets are at 1.2. They adjust procurement to focus on high-GMROI SKUs, boosting overall profitability without increasing stock.
What it is: The total cost of holding inventory, including storage, insurance, depreciation, and opportunity cost.
Why it matters: Carrying costs tie up cash that could be used elsewhere in the business. Ecommerce businesses with multiple warehouses or seasonal inventory need to monitor this KPI to optimize stock levels and improve cash flow.
Example: An online apparel brand calculates carrying costs at 22% of inventory value. By reducing excess seasonal stock and improving reorder timing, they cut costs to 15%, freeing capital for marketing campaigns.
What it is: Measures how efficiently inventory assets are generating revenue. Formula: Revenue ÷ Average Inventory Value.
Why it matters: A higher ROI indicates effective inventory use, while a low ROI suggests overstocking or poor sales alignment. Ecommerce brands can use this KPI to prioritize high-performing SKUs and reduce underperforming ones.
Example: A home décor ecommerce store finds their decorative lamps have an ROI of 3, while furniture items sit at 0.8. They scale promotions for lamps and limit furniture purchases, improving overall inventory efficiency.
Tracking inventory KPIs doesn’t have to be complex. Here’s how ecommerce brands can do it efficiently:
Understanding average KPI benchmarks allows ecommerce brands to evaluate performance and spot areas for improvement. While numbers vary by industry, here are some common reference points:
Caveat: Benchmarks differ by industry. Fashion brands often see higher returns but faster turnover; electronics have slower turnover but lower returns; FMCG requires rapid turnover and strict lot control.
Example: A D2C footwear brand tracks KPIs across three warehouses: 96% inventory accuracy, 7x turnover, 4% stockout rate, and 92% perfect order rate. By benchmarking against these targets, they optimize procurement, avoid overstock, and improve customer satisfaction.
Style levelSell-through with OOS days —
adjusted,Gross margin, ageing etc.
Tracking the right inventory KPIs is crucial for ecommerce businesses to stay efficient, profitable, and competitive. From inventory accuracy and turnover to sell-through rates and GMROI, each KPI provides actionable insights that help brands reduce stockouts, optimize cash flow, and improve customer satisfaction.
By leveraging automated inventory management systems like EasyReplenish, ecommerce businesses can monitor these KPIs in real-time, set alerts for potential issues, and make data-driven decisions without drowning in spreadsheets. Regularly benchmarking performance against industry standards ensures your inventory operations remain lean, responsive, and ready to scale as your business grows.

No credit/debit card required • Cancel anytime
.png)

.png)