Demand forecasting helps teams estimate future customer demand before inventory, staffing, or production issues appear. Without it, businesses often react too late. They buy too much, run out of key products, overstaff slow periods, or miss capacity constraints.
This Demand Forecasting Implementation Guide gives first-time implementers a practical sequence. You will learn how to define the decision, prepare the data, choose a fit-for-purpose method, validate performance, and embed the forecast into daily workflows.
The goal is not to build a perfect prediction engine on day one. The goal is to create a repeatable process that helps teams make better operating decisions with less guesswork.
What is Demand Forecasting?
Demand forecasting is the process of estimating future customer demand over a chosen time horizon. It uses historical data, market signals, and business assumptions.
In simple terms, it answers: “How much will customers likely want, when, and where?”
That answer can support many decisions. It can help a retailer place purchase orders before a seasonal rush. It can help a manufacturer plan production. It can help a service business schedule staff for peak demand.
For example, a retailer may forecast weekly demand for patio furniture before spring. If the forecast shows demand rising in March, the buying team can order earlier. Store teams can also prepare space, staffing, and promotions.
Sales forecasting: often focuses on expected revenue, bookings, or commercial targets.
Inventory planning: decides how much stock to hold, where to place it, and when to replenish.
Demand planning: turns the forecast into a cross-functional plan across supply, capacity, finance, and sales.
Forecasting is not about certainty. It is about improving decisions before problems become expensive.
Why Modern Businesses Implement Demand Forecasting
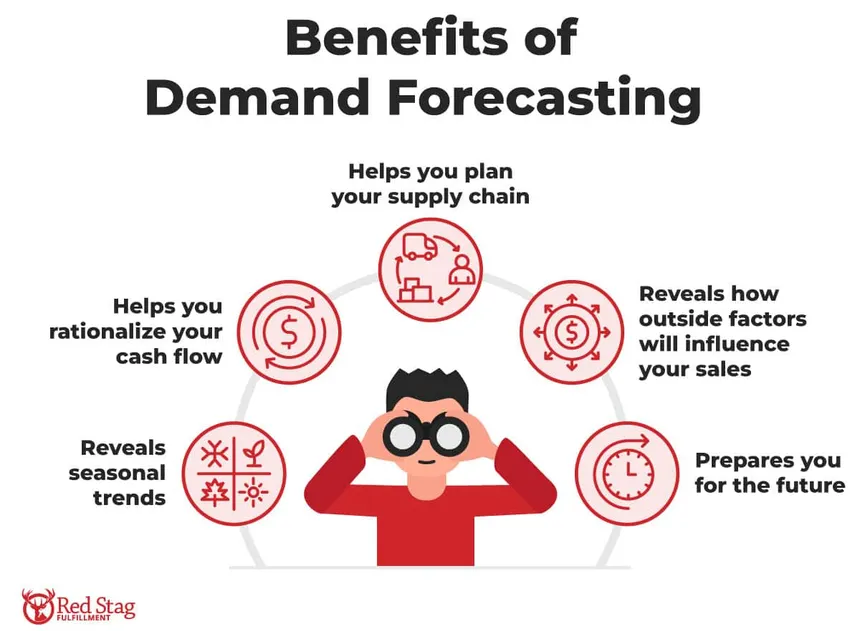
Modern businesses implement demand forecasting because future demand affects almost every operating function. It is not just an analytics project. It is an operating discipline.
A forecast can improve planning across supply chain, finance, sales, operations, and customer experience. When teams share a demand view, they can make better tradeoffs.
Key outcomes include:
Fewer stockouts: planners can replenish before customers face unavailable products.
Less overstock: teams avoid buying or producing more than they can sell.
Better cash-flow planning: inventory, capacity, and purchasing decisions tie up working capital.
Smarter staffing and capacity planning: teams align labor, warehouse space, or production with expected demand.
Improved S&OP decisions: forecasts provide demand-side input for cross-functional planning.
Forecasting reduces uncertainty, but it does not remove volatility. Weather shifts, supplier delays, competitor actions, and economic changes can still disrupt demand.
The value comes from being less surprised. A business with a working forecast can spot risks earlier and respond faster.
What is the Forecasting Objective
Before choosing tools or models, define the decision the forecast will support. A monthly revenue forecast is different from a weekly SKU-location replenishment forecast.
Start with these checkpoints:
Decision: What action will change because of the forecast? Examples include replenishment, production, hiring, promotion planning, purchasing, or revenue planning.
Forecast horizon: How far ahead must the business decide? This could be days, weeks, months, quarters, or years.
Cadence: How often will the forecast refresh? Common options include daily, weekly, biweekly, or monthly.
Level of detail: What output does the decision need? This may be total demand, category, SKU, location, channel, or customer segment.
Business owner: Who accepts, challenges, and acts on the forecast?
Success metric: What does “useful” mean? It may mean lower stockouts, less excess inventory, better service levels, or improved budget accuracy.
Workflow: Where will the forecast be reviewed and used? This could be an ERP, replenishment tool, production plan, dashboard, or S&OP cycle.
This step prevents a common failure. Teams often build technically sound forecasts that no one uses.
A useful forecast must fit the decision. If the forecast does not change an action, the scope needs more work.
Demand Forecasting Process Steps
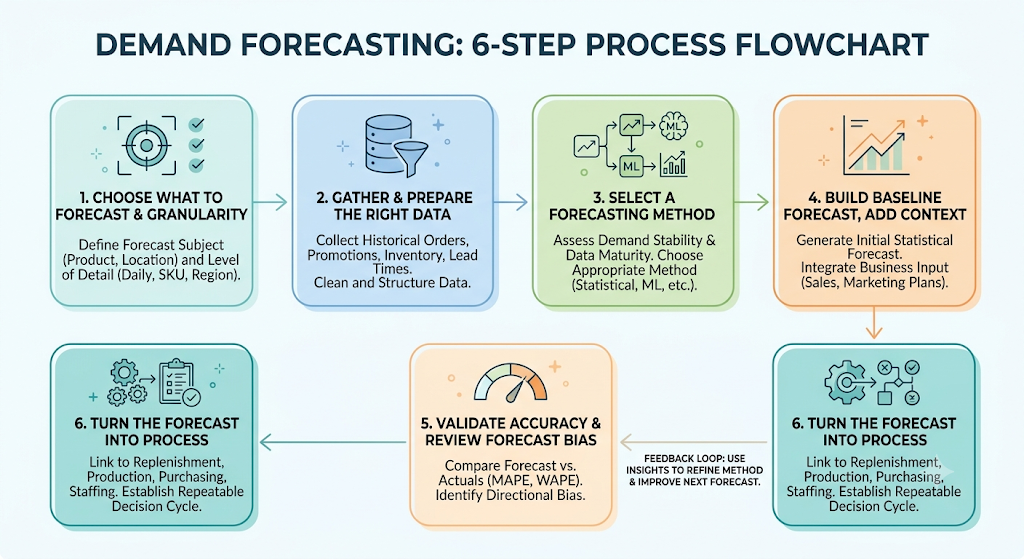
Step 1: Choose What to Forecast and at What Granularity
Once the objective is clear, choose the forecasting level. Granularity means the level of detail at which the forecast is produced.
Common options include:
Total company demand: useful for executive planning and high-level capacity assumptions.
Product category: useful when category buying or production matters more than item detail.
SKU or item: useful for replenishment, assortment, and inventory control.
Location: useful for stores, warehouses, regions, or distribution networks.
Channel: useful when ecommerce, retail, wholesale, marketplace, or direct sales behave differently.
Customer segment: useful for B2B, subscription, or account-based demand patterns.
Item-location combination: useful when local availability and replenishment decisions matter.
More granular forecasts can be more actionable. They also need cleaner data and stronger process discipline.
Low-volume items can be noisy. Intermittent demand can make item-level predictions unstable. For a first implementation, consider a focused pilot.
Choose high-impact products, locations, or categories. Learn from that scope before expanding across the business.
Step 2: Data Aggregation and Data Cleansing
Data preparation is where many forecasting projects succeed or fail. The model can only learn from the signal it receives.
Your downstream forecast can only perform as well as the historical data it receives. To build an accurate baseline, planners must aggregate and unify historical signals into a clean, complete dataset across multiple points:
Unconstrained Demand Tracking: Isolate and flag historical stockout intervals. If a product was out of stock for three weeks last year, your system will record zero sales; treating this gap as low customer demand will cause your model to replicate the stockout in the next cycle.
Anomaly Isolation: Separate baseline sales records from temporary promotional lifts, marketing campaign spikes, price drops, or extreme weather events.
Data Alignment: Standardize divergent units of measure, eliminate duplicate order logs, and formally document data transformation rules for future systematic refreshes.
Use this data cleansing checklist:
Remove duplicates.
Standardize units of measure.
Fill or flag missing periods.
Correct obvious data entry errors.
Flag stockout periods instead of treating all zero sales as zero demand.
Tag promotion and one-off event periods.
Document transformations for future refreshes.
Do not rush this step. Clean data makes simple methods stronger and advanced methods more reliable.
Step 3: Select a Forecasting Method That Fits Your Maturity
The best forecasting method depends on demand stability, data quality, business complexity, and the decision being supported.
Think of method selection as a maturity ladder.
Simple methods: moving averages and seasonal averages create a readable baseline for stable demand.
Exponential smoothing and time-series methods: useful when history shows clear trends and seasonality.
Qualitative methods: sales input, expert judgment, surveys, and customer conversations help when history is thin.
Regression or causal methods: useful when demand responds to price, promotions, weather, marketing, or economic drivers.
AI/ML methods: useful for larger, data-rich environments with many products, locations, channels, and external signals.
Start with a baseline the business can understand. A simple forecast that people trust often beats a complex model that no one can explain.
Increase sophistication only when it improves decisions. More advanced methods should reduce meaningful errors, improve service, or lower cost.
Step 4: Build a Baseline Forecast, Then Add Business Context
A strong implementation uses two layers. First, create a statistical baseline. Then add structured business context.
The baseline forecast gives the team a neutral starting point. It is based on history, selected methods, and defined assumptions.
From there, teams can add information the model may not see yet.
Useful business context includes:
Sales input on large opportunities, customer losses, or account changes.
Marketing plans for campaigns, promotions, launches, or events.
Operations input on capacity limits, supplier constraints, or lead-time changes.
Customer input from contracts, preorders, or planned buying cycles.
Finance assumptions about budgets, pricing, margin, and working capital.
Do not allow every stakeholder to freely overwrite the forecast. That creates confusion and weakens trust.
Instead, create a structured review process. Each adjustment should have a named assumption, time period, owner, and reason.
The goal is a consensus view that improves the forecast. It should not become a negotiated number with no evidence trail.
Step 5: Validate Accuracy and Review Forecast Bias
Forecast validation should answer two questions: How wrong is the forecast? and Is it consistently wrong in one direction?
You do not need to start with complex measurement. Begin with practical metrics the business can understand.
Common options include:
Forecast error: the difference between forecasted demand and actual demand.
MAPE: a percentage-based error metric that is easy to explain.
WAPE: a volume-weighted metric that helps compare products or locations with different volumes.
Bias: whether the forecast tends to over-forecast or under-forecast.
MAPE can be misleading when actual demand is very low or zero. WAPE may be better for portfolios with varied volume.
Use this validation sequence:
Backtest the forecast against past periods not used for training.
Compare performance against a naive baseline, such as last period or last year.
Review outliers, including stockouts, promotions, launches, and one-time events.
Segment results by product, location, channel, and volume tier.
Investigate persistent bias where forecasts consistently over- or under-predict.
The best metric depends on the decision. Replenishment may care most about stockout risk. Finance may care more about monthly variance.
Validation should lead to action. If the forecast is biased, identify the source and adjust the process.
Step 6: Turn the Forecast Into an Operating Process
A forecast creates value only when it changes decisions. This step moves the work from analytics into execution.
Connect forecast outputs to real workflows:
Replenishment: reorder points, safety stock, purchase recommendations, and stock transfers.
Purchasing: supplier commitments, purchase orders, order timing, and lead-time planning.
Production: schedules, materials planning, capacity allocation, and changeover planning.
Staffing: labor schedules, warehouse staffing, customer support, or service capacity.
Finance: budgets, cash-flow planning, working-capital assumptions, and scenarios.
Dashboards and systems: ERP, replenishment engines, BI dashboards, planning tools, and exception reports.
S&OP or planning meetings: cross-functional review of demand, supply, capacity, and finance.
Forecasting should become a repeatable decision cycle. Define the refresh cadence, owners, review meetings, and exception rules.
The first forecast is not the finish line. Demand patterns change as prices, products, suppliers, and markets change.
Continuous improvement keeps the process useful. Review accuracy, collect feedback, and refine assumptions over time.
Common Implementation Mistakes to Avoid
Use this section as a quick self-audit before launching or expanding.
Common pitfalls include:
Starting with software before objectives: tools cannot fix unclear business decisions.
Using dirty or incomplete data: unreliable inputs create unreliable forecasts.
Ignoring stockouts: zero sales during no-stock periods can hide unmet demand.
Ignoring promotions and one-off events: temporary spikes or drops can distort future patterns.
Forecasting at the wrong level: too high-level may be unusable, while too granular may be noisy.
Chasing perfect accuracy: the goal is a better operating decision, not a flawless number.
Excluding frontline teams: sales, operations, service, and planners often know key exceptions.
Failing to monitor after launch: demand patterns, assortments, prices, suppliers, and markets change.
If the forecast is not trusted, reviewed, or acted on, accuracy alone will not make it successful.
Demand Forecasting Implementation Checklist
Use this streamlined, 5-phase checklist to govern your initial software deployment or audit your active operational process:
Scope Definition & Ownership: Define the exact business decision the forecast will support, set the required horizon and granularity (SKU, channel, location), and establish clear business owners.
Data Aggregation & Cleansing: Gather historical sales, pricing, promotions, and lead times while isolating duplicates, correcting gaps, and explicitly marking historical out-of-stock periods.
Baseline Generation & Context Layering: Produce a clear statistical baseline forecast from clean history, then overlay documented, owner-backed assumptions from sales, marketing, and finance teams.
Validation & Stakeholder Consensus: Backtest the models against historical actuals to calculate error (WAPE) and directional bias, then align cross-functional stakeholders on exceptions and risks.
Operational Integration & Continuous Audit: Sync finalized forecast outputs directly to execution workflows (ERP, replenishment engine, or S&OP) and monitor error trends continuously to refine the model.
If you manage replenishment or planning, use this checklist before evaluating software. Tools such as EasyReplenish can support better workflows, but clear decisions and clean inputs come first.
Conclusion
Demand forecasting implementation works best when it starts with a clear business decision. It should not start with a model or tool. Follow the six-step flow: define the objective, choose granularity, prepare data, select a maturity-appropriate method, build and validate the forecast, then embed it into workflows. Those workflows may include replenishment, production, staffing, finance, dashboards, or S&OP meetings. The forecast should become part of how the business operates. As a next step, use the checklist to identify the weakest link in your current planning process. Fix that gap before expanding scope or investing in more advanced forecasting technology.





.png)